Fish and Aquaculture Feed Plant Financial Model
Description
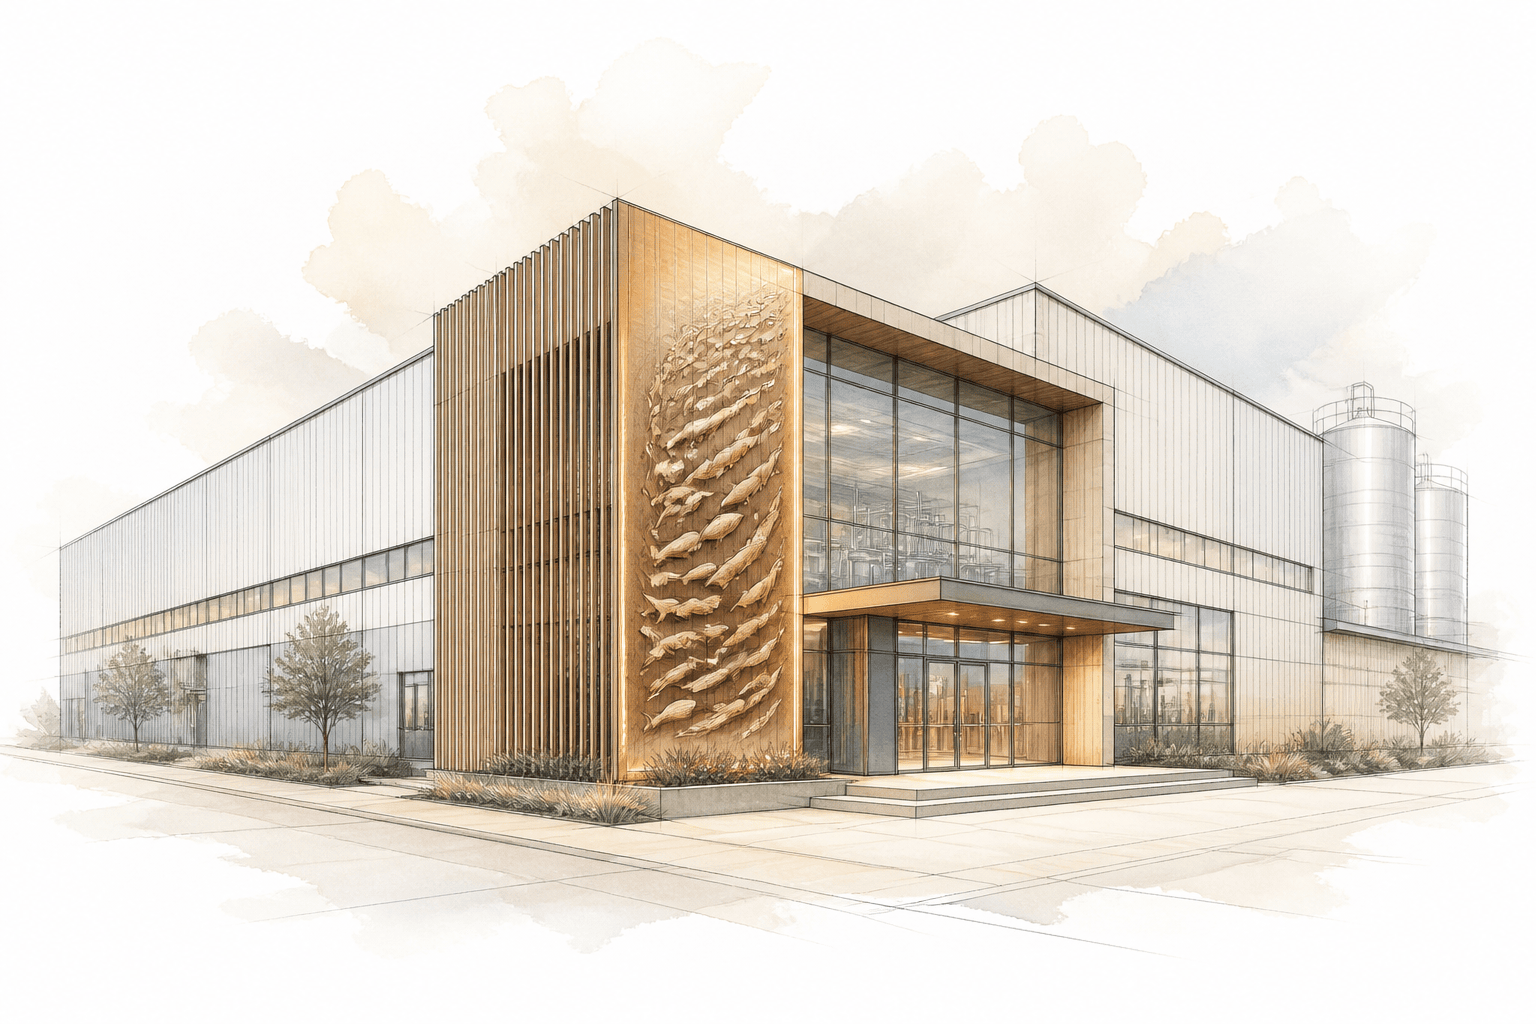
The model covers an industrial plant producing extruded and pelleted feeds for major aquaculture species such as salmon, trout, shrimp, tilapia, and seabass. Production encompasses intake and storage of dry and liquid raw materials, grinding, mixing, extrusion/pelleting, drying, coating, cooling, screening, and bulk or bagged outloading.
A key differentiator is the recipe-driven architecture: each feed type—starter, grower, finisher, broodstock—draws on its own bill of materials, with ingredient prices linked to global commodity benchmarks. The model handles a wide range of raw ingredients with varying inclusion rates, enabling precise margin analysis per SKU.
Seasonal demand patterns are built in month-by-month, reflecting the natural cycles of aquaculture production, with corresponding inventory build-up of perishable and non-perishable raw materials, cold storage for fishmeal and oils, and just-in-time additives management. The model quantifies working-capital swings and the effect of procurement timing on cash flow.
The investment logic separates the processing core (grinding, extrusion, drying) from supporting infrastructure (silos, utilities, water treatment, labs) and is shown in an order-of-magnitude estimate; actual values will depend on local conditions and capacity. The financial structure can accommodate multiple debt tranches, equipment leasing, and government grant inflows.
Modeling specifics
- Multi-species & multi-recipe production scheduling: the model plans campaigns for different feeds on shared lines, accounting for changeover downtime, minimum lot sizes, and line-dependent throughput rates — avoiding the unrealistic assumption of continuous full-load operation.
- Ingredient price dynamics: key proteins (fishmeal, soy concentrate) and oils are modeled with forward price curves or user-defined escalation, plus optional margin-over-commodity for specialty premixes, so feed cost accurately follows input volatility.
- Perishability & shelf-life constraints: raw materials with limited shelf life (e.g., fresh oils, certain vitamin premixes) carry spoilage risks; the model can cap inventory duration, automatically increasing waste cost if inventory ages beyond usable windows.
- Energy & utility elasticity: extrusion and drying are highly energy-intensive; consumption of natural gas/electricity is linked to throughput and moisture removal targets, not a flat percentage. Costs reflect part-load inefficiencies during low-season runs.
- Automatic working-capital bridge: the model captures the gap between raw material procurement, payables, production cycle, stock of finished goods, and receivables from farmers, which can extend for 2–4 months for large contracts, highlighting the sector’s financing needs.
- Co-product & waste valorisation: off-spec product, screening fines, and organic sludge are modeled either as a disposal cost or as a by-product revenue stream (e.g., low-grade feed for non-commercial use), affecting both P&L and ESG compliance.
- Tax & incentive scenarios: special economic zones, import duties on strategic ingredients, and local aquaculture incentives can be toggled, altering effective production cost and payback profiles.
What's included in the base version
- Production model with configurable line capacity and up to 5 species groups / 20 recipes
- Raw material purchase and inventory (dry, liquid, cold storage) with monthly reorder logic
- Recipe-based variable cost engine (ingredient, energy, packaging, additives, water, effluent)
- Fixed operating cost block (maintenance, QA/QC lab, staff, compliance, insurance)
- Personnel plan by department (production, warehouse, admin, sales)
- CAPEX schedule: processing, utilities, silos, civil works, capitalized pre-production expenses
- Financing: senior debt, junior debt, leasing, grants with flexible repayment profiles
- Full financial statements: monthly P&L, cash flow, balance sheet over 10–15 years
- Investment metrics: NPV, IRR, DPP, debt service coverage ratios
- Break-even & sensitivity analysis (one-way and two-way tables)
Common modeling mistakes
- Assuming constant 90%+ utilization year-round without seasonal downtime — capacity availability is overstated by 15–25%, leading to unrealistic revenue forecasts.
- Modeling all feed products with a single blended gross margin — variable contribution is distorted by 5–10 percentage points, masking loss-making SKUs.
- Ignoring the lag between raw material payment (often prepayment for fishmeal) and customer collections — liquidity gap is underestimated by 2–4 months, resulting in a cash crunch.
- Treating energy as a fixed percentage of revenue rather than a throughput- and moisture-dependent variable cost — energy cost is misstated by ±20–30% between high and low seasons.
- Omitting changeover and cleaning downtime between batches of different species feed (e.g., salmon to shrimp) — effective capacity is overstated by 10–15%.