Museum of Illusions Financial Model
Description
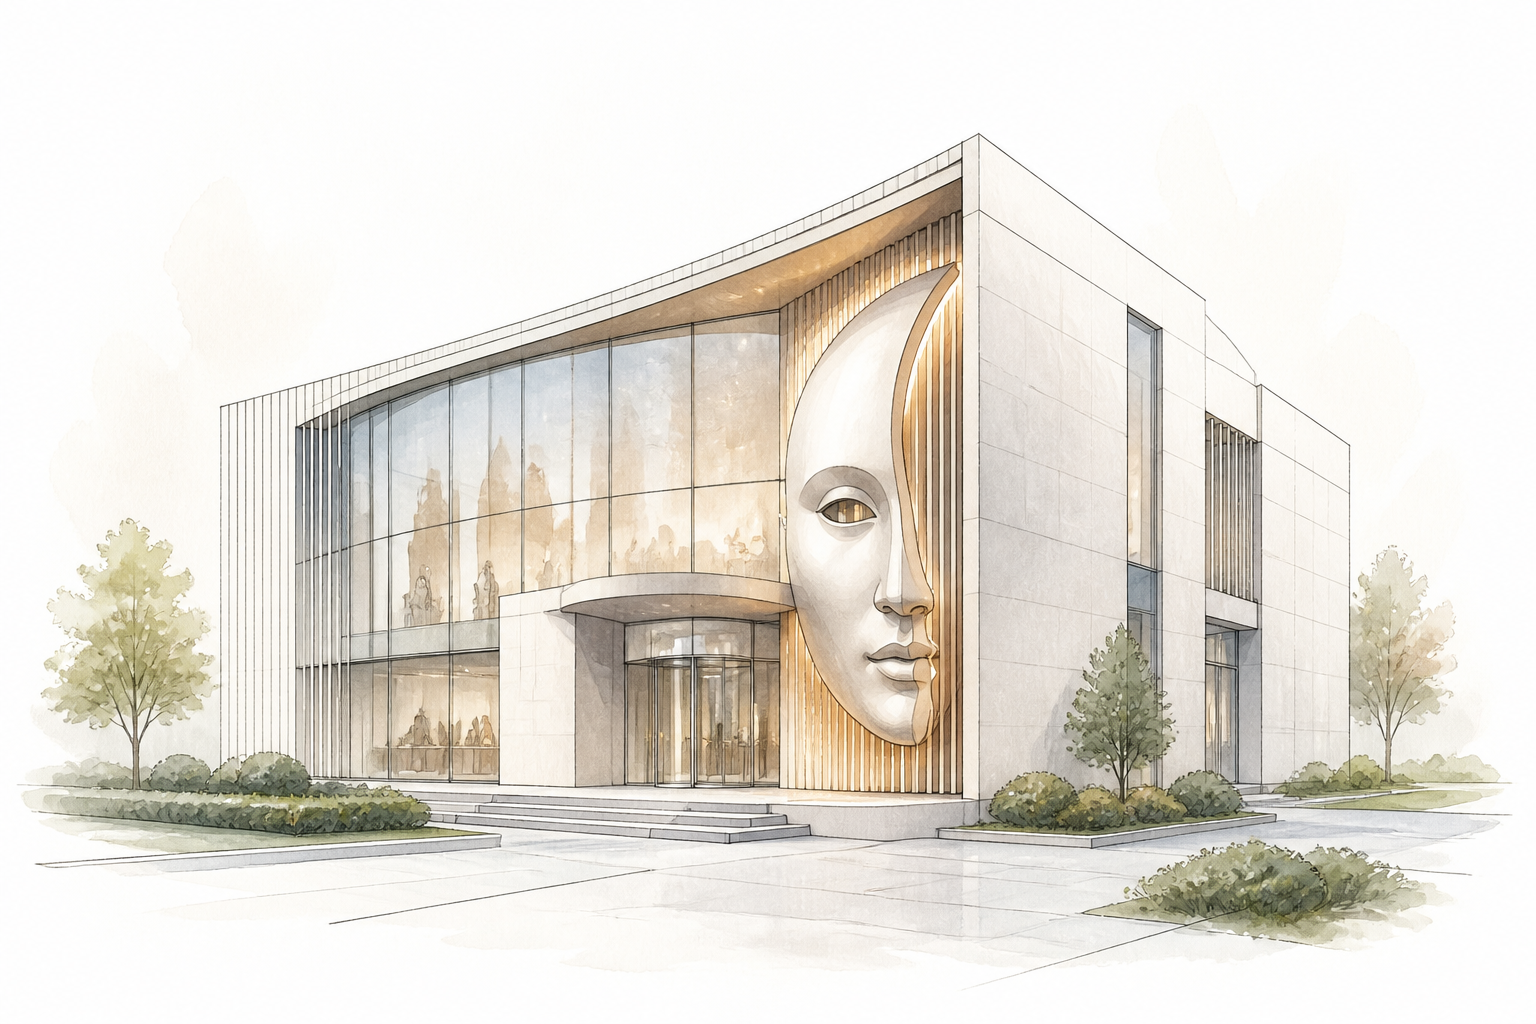
This Excel model simulates a Museum of Illusions as a multi-hall experiential attraction with a complex visitor flow. It captures the interplay of different exhibit halls, each with its own capacity and dwell time, leading to a natural daily throughput bottleneck. The admission revenue engine accounts for multiple ticket types — adult, child, family, student — and pre-booked group and school visits that secure capacity in advance. Seasonality is built in month-by-month, and the model allows distinct weekday/weekend attendance curves to reflect tourism and local visitor patterns.
Beyond entry fees, the model fully integrates event space rental (corporate, private parties) with its own booking and pricing calendar, avoiding double-counting of capacity. Additional revenue streams — gift shop retail, photo kiosks, a small café — are linked to footfall metrics. On the cost side, the model distinguishes between one-time capital expenditures (leasehold improvements, illusion installations, AV equipment) and operating expenses, including variable guide staffing per visitor volume, marketing, maintenance of illusions, and insurance. A special exhibit refresh reserve automatically sets aside a portion of revenue to anticipate periodic replacement of worn exhibits.
The financial model provides a robust forecast of cash flows, funding requirements, and returns over a 5- to 10-year horizon. While it shows an indicative total investment range to give a sense of scale, this is not a final figure but a logical aggregation of construction, fit-out, pre-opening, and working capital needs. With a built-in dynamic dashboard, you can immediately see occupancy rates, breakeven visitor counts, and margin evolution, making it a practical decision-making tool for operators and investors.
Modeling specifics
- Dynamic multi-hall throughput: Each hall’s hourly capacity, dwell time, and sequenced flow determine total daily visitors; no oversimplified aggregated capacity.
- Seasonal & day-of-week decomposition: Separate month-by-month seasonality curves and weekday/weekend factors avoid the “average month” trap and produce realistic monthly revenue swings.
- Pre-committed group/school block logic: Allocates a portion of daily capacity to groups at discounted rates, reducing general admission availability but ensuring baseline volume; models no-show risk.
- Integrated event calendar & capacity lock: Event days reserve entire venue or specific halls, temporarily disabling public admission and switching to event-specific P&L, preventing revenue double-counting.
- Exhibit refresh cycle & capex reserve: Models limited useful life of illusion installations (e.g., 4–6 years) and builds an automatic sinking fund from operations, preventing hidden cash calls.
- Realistic ramp-up curve: Visitor occupancy starts low (soft opening) and follows a non-linear growth path over 12–18 months, avoiding overly optimistic early-period revenue.
What's included in the base version
- Full three-statement (P&L, cash flow, balance sheet) monthly for 5 years, with annual summaries.
- Multi-hall admission capacity model with dwell-time bottlenecks and daily visitor simulation.
- Ticket mix engine: adult, child, family, student, and group/school with discount schedules.
- Event space rental module with calendar, utilization rates, and variable pricing.
- Ancillary revenue streams: gift shop, photo sales, café – all linked to visitor volume.
- Detailed opex: variable guide staff per visitor, fixed admin, marketing, maintenance, insurance.
- Capital expenditure schedule with phased leasehold improvements, exhibit fabrication, FF&E.
- Debt and equity financing with a cash sweep mechanism and interest calculation.
- Investor dashboard & KPIs: occupancy %, average ticket yield, event utilization, breakeven point.
- Valuation output: DCF, IRR, equity multiple, payback period.
Common modeling mistakes
- Applying uniform daily attendance without considering dwell time — overstates daily visitors by 20–40% and inflates revenue forecasts.
- Ignoring seasonality and treating all months as equal — understates peak-period staffing needs and overestimates off-peak margins, distorting cash flow timing.
- Pricing all visitors at walk-in adult rate — inflates average ticket revenue by 25–35%, especially in markets with heavy school traffic.
- Not reserving venue capacity for private events — leads to double-counting of admission and event revenue, overstating total sales by 10–15%.
- Omitting exhibit refresh capital expenses — creates a hidden cash drain 3–5 years in; model automatically sets aside 3–5% of gross revenue for renewal reserves.