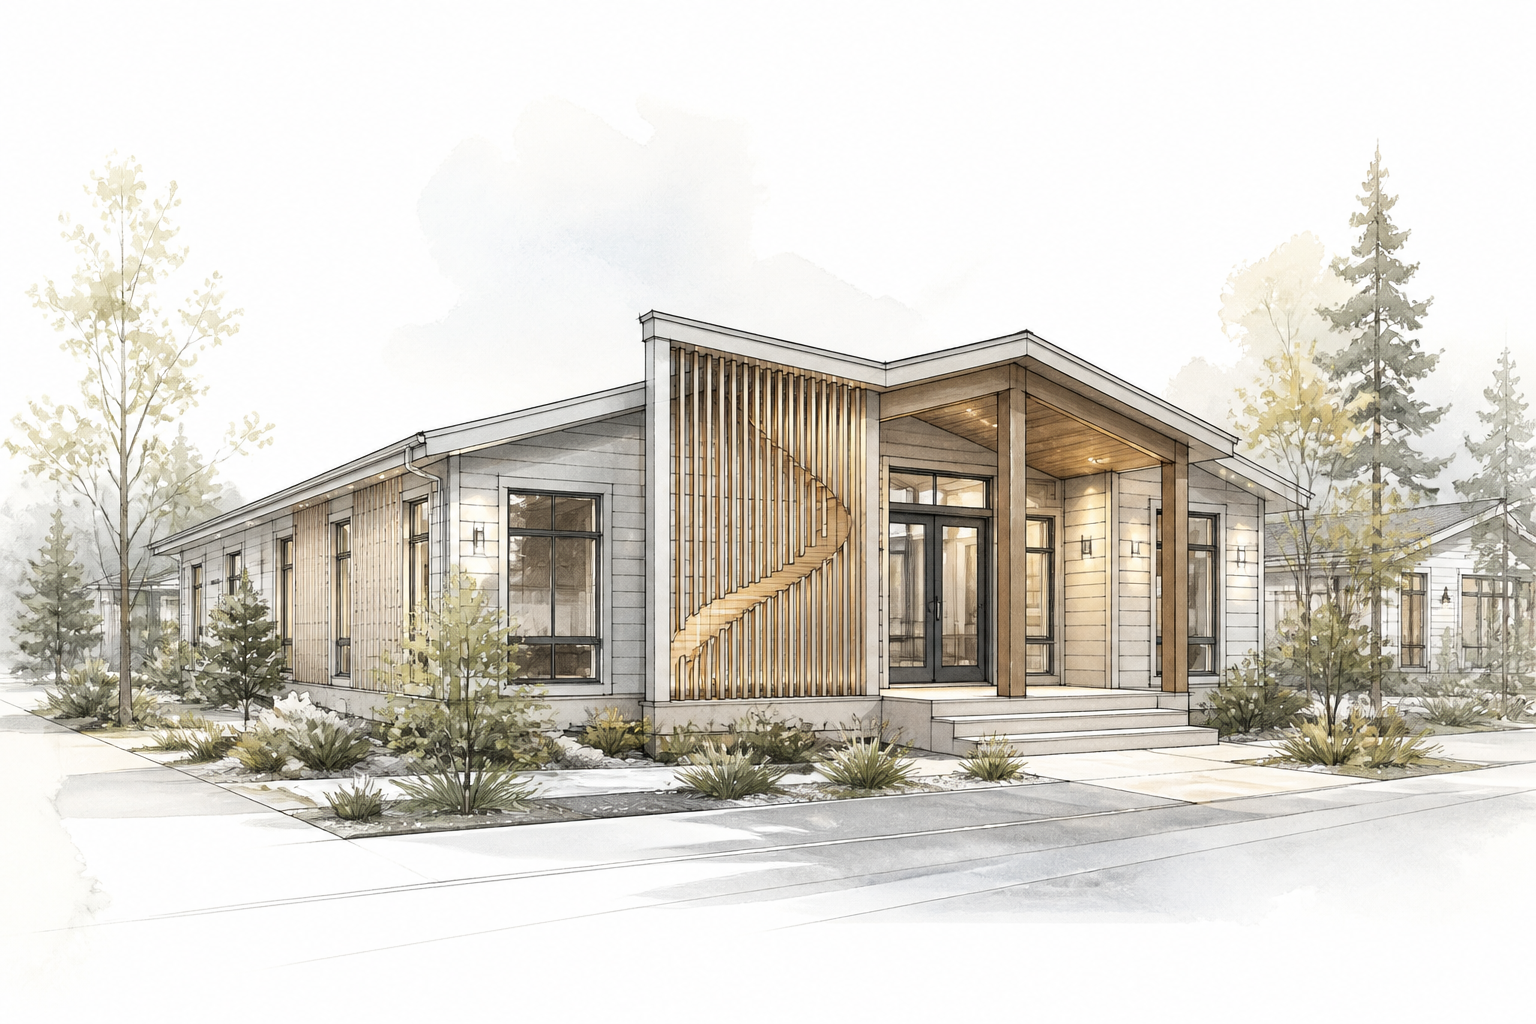
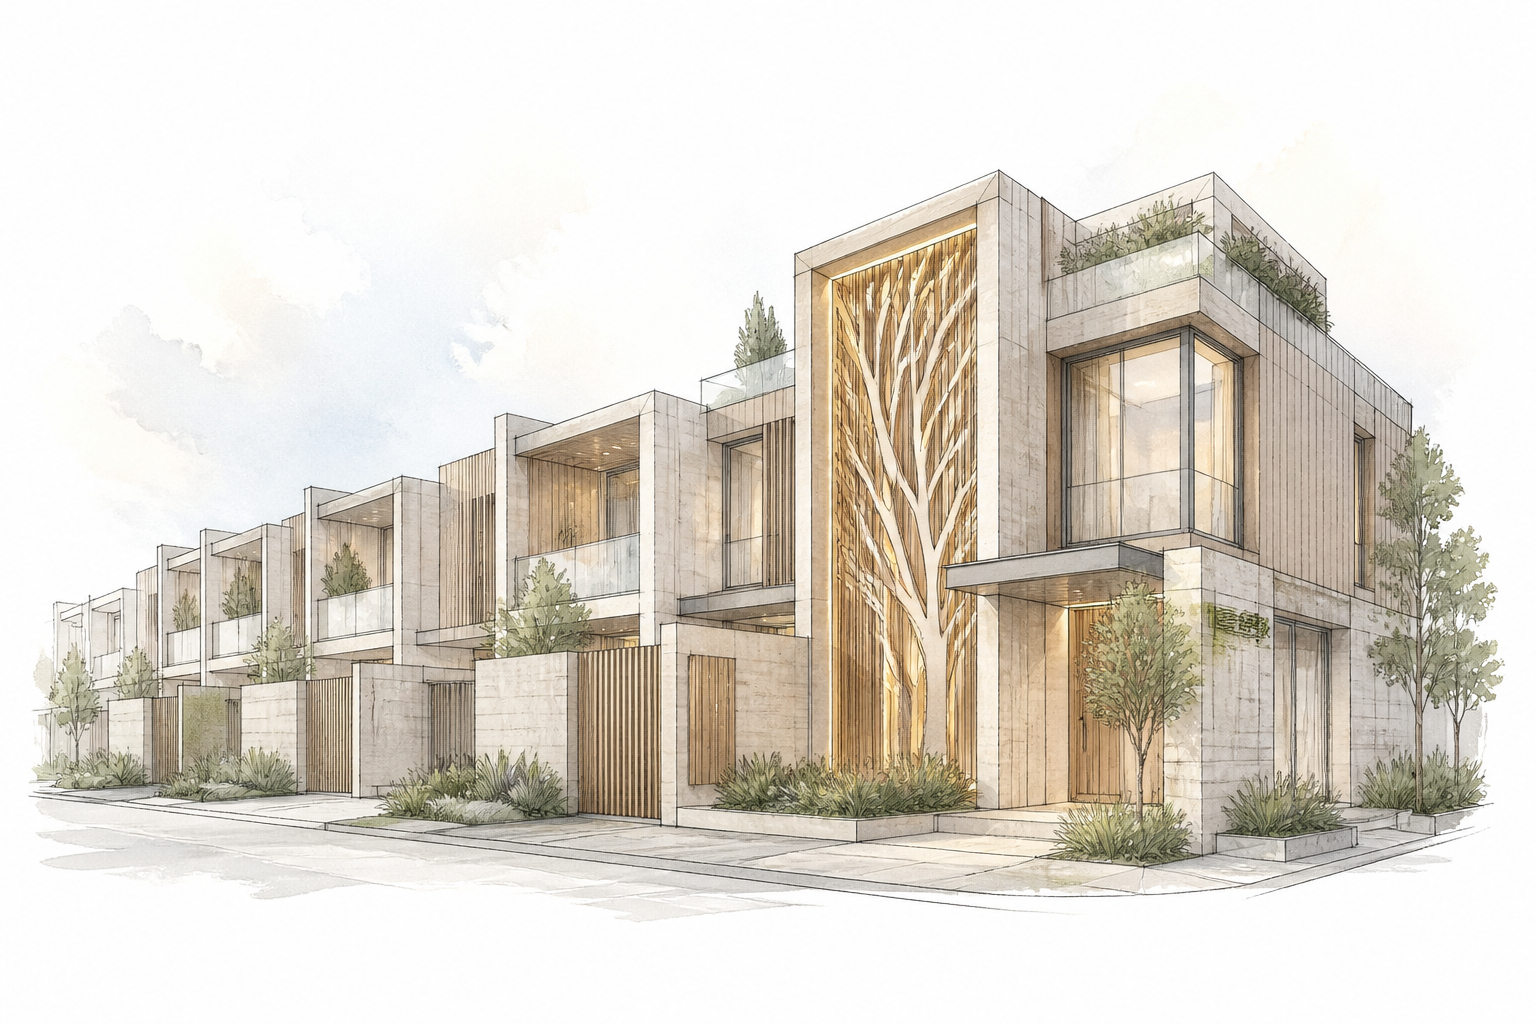
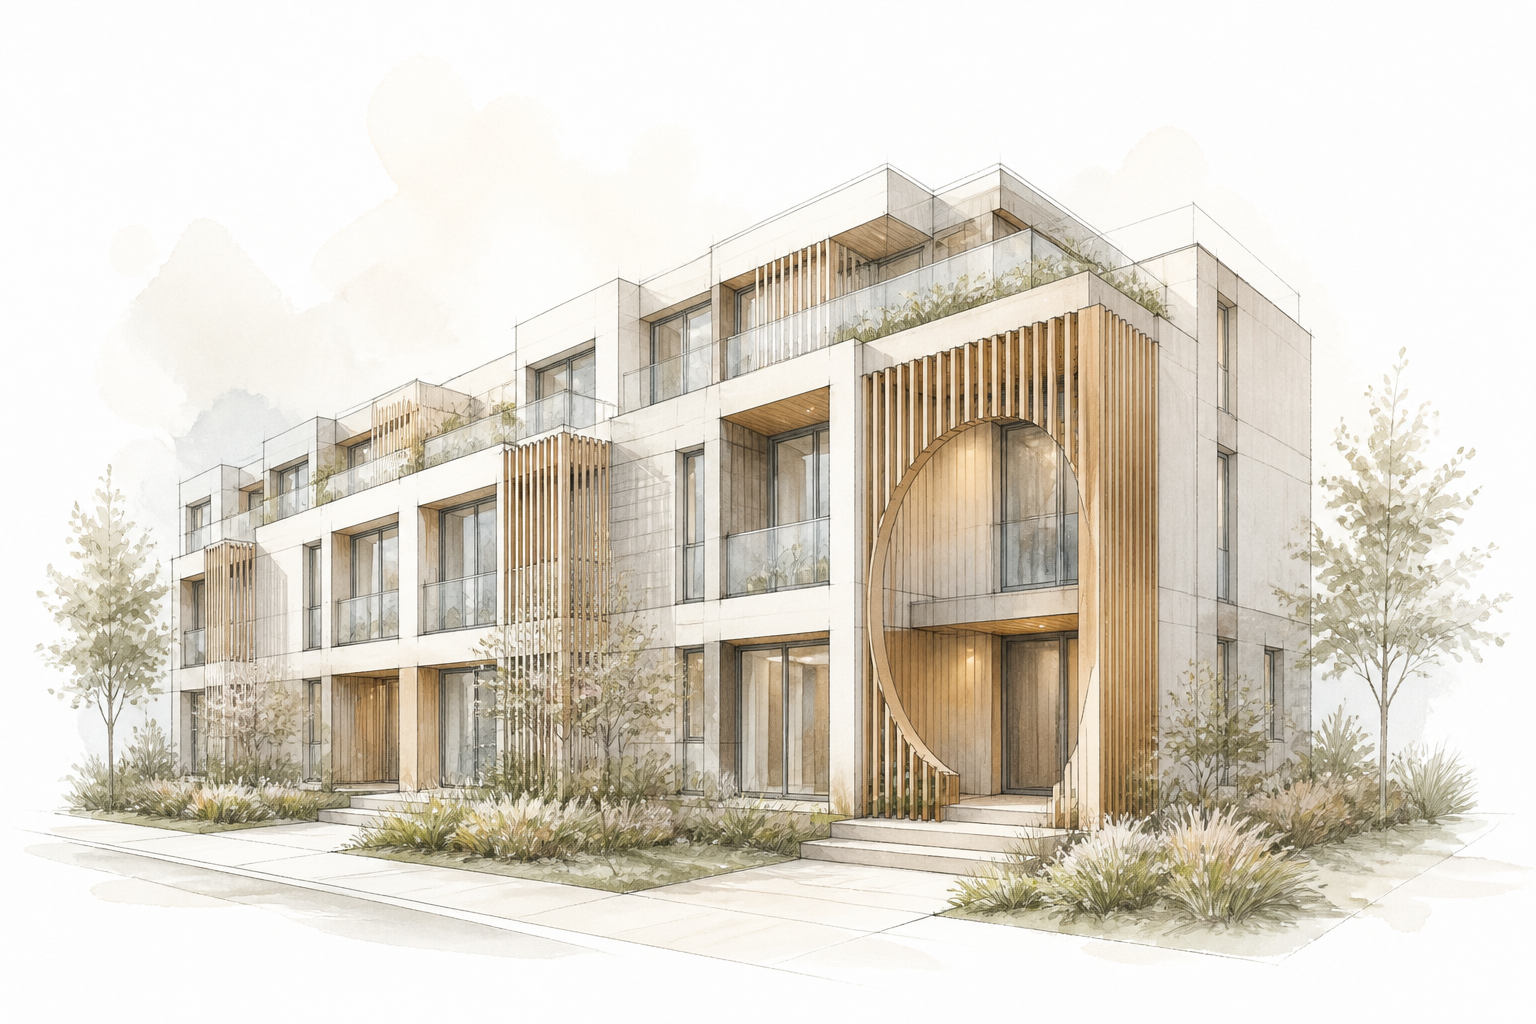
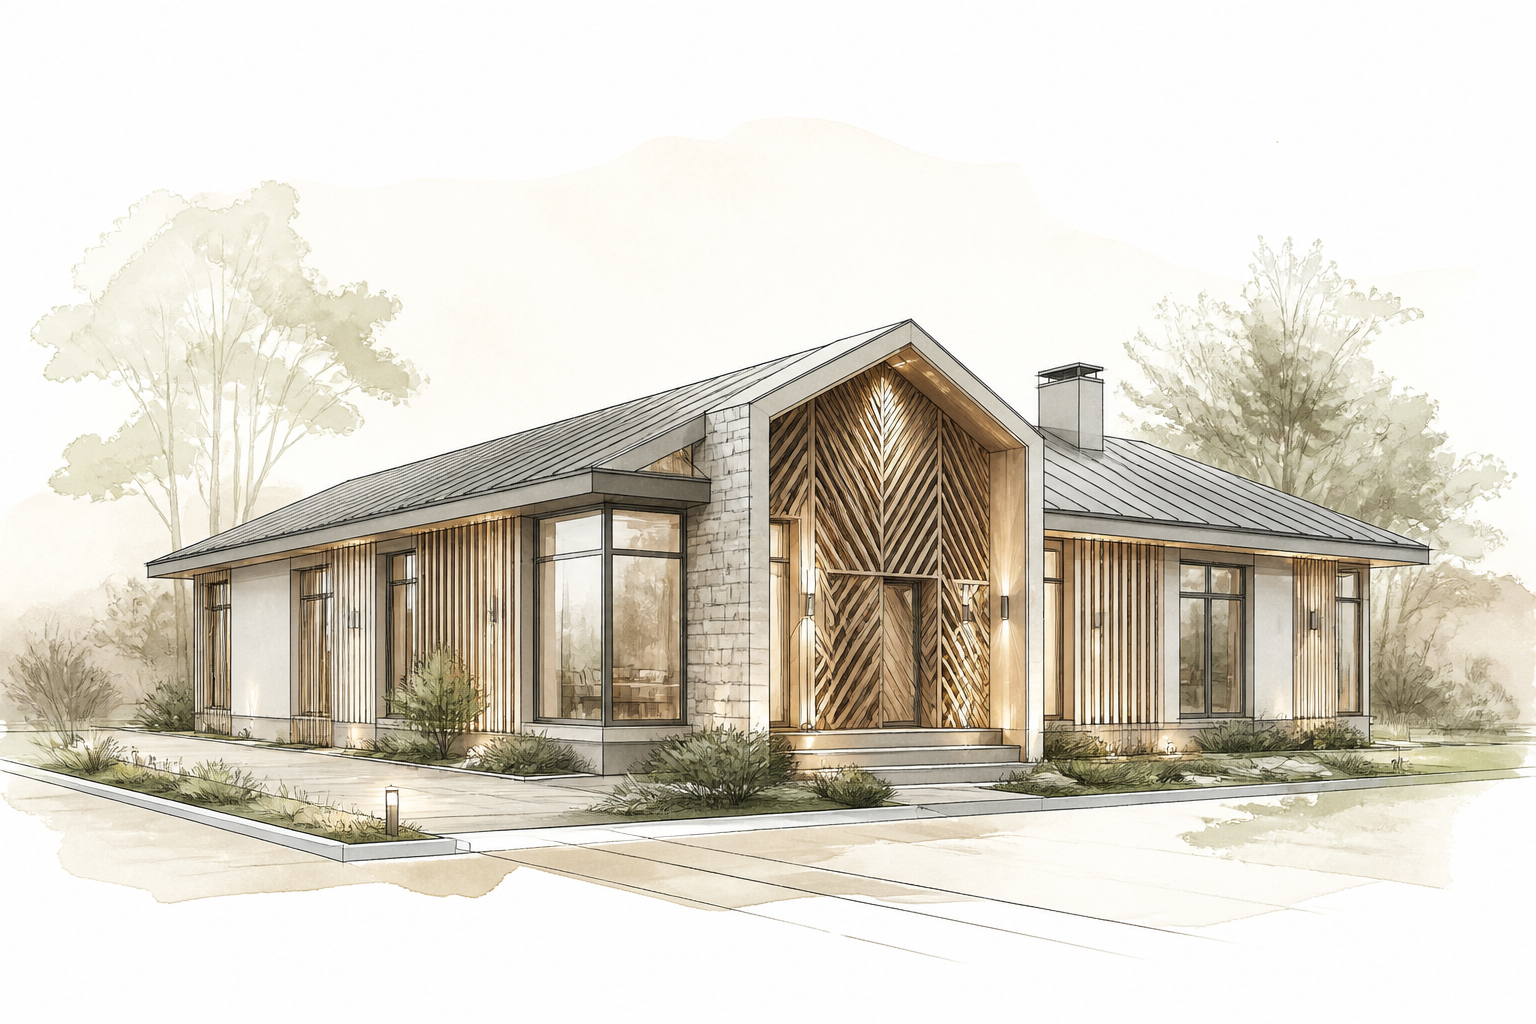
Manufactured Housing Community Development Financial Model
Description
The model captures a greenfield manufactured housing community development from raw land through stabilized operations. It simulates phased construction of pads, infrastructure build-out, and gradual lease-up of residential pads to home-owning residents, accounting for household move-in dynamics and seasonal leasing fluctuations.
Revenue streams are granular: monthly pad rent per lot with scheduled rent escalations, utility billing (water, sewer) either pass-through or sub-metered with markup, plus ancillary income such as late fees, pet rent, and RV/boat storage. Operating expenses reflect maintenance of roads, common areas, water/sewer systems, property management, insurance, and property taxes, with the option to model off-site utility costs versus on-site well/septic.
The capital stack includes phased land and infrastructure investment, construction loan draws with interest capitalization, and optional permanent take-out financing. The model projects levered and unlevered cash flows, calculates investor returns (IRR, equity multiple), and values the stabilized community via direct capitalization, highlighting the sensitivity of exit cap rate, occupancy, and rent growth.
Modeling specifics
- Multi-phase pad absorption engine with customizable absorption curves, lease-up incentive packages, and stabilization timeline – captures the real ramp-up lag and its impact on early returns.
- Distinct utility billing logic: master-meter passthrough, individual sub-metering with markup, vacancy loss allocation, and seasonal usage fluctuation – prevents overstatement of net utility recoveries.
- Home turnover and dark pad modeling – when a resident moves, the pad may remain vacant while the home is sold or removed; the model applies a frictional vacancy overlay that reduces occupancy during turnover.
- Construction debt draws linked to actual monthly cash needs, with interest capitalized on outstanding balances, rather than simplistic S-curve assumptions, reflecting true financing cost dynamics.
- Asset tax depreciation split between land (non-depreciable) and improvements (roads, utilities, pads) over appropriate recovery periods, affecting after-tax cash flow and exit gain calculations.
- Granular operating expense allocator that separates common-area utility costs from pass-through to residents, variable maintenance tied to occupied pad count, and fixed property management fees.
- Stabilized exit valuation via direct cap rate with built-in sensitivity to both market cap rate and NOI, plus a land appreciation overlay to assess developer profit upon sale of fully stabilized community.
What's included in the base version
- Interactive dashboard with key performance metrics and toggle controls for occupancy, rent, and expenses
- Monthly phased absorption and construction timeline (up to 5 phases) with scheduled pad delivery and lease-up
- Pad rent revenue schedule with annual escalation factors per lot type
- Utility billing module (master-meter pass-through default) with cost recovery ratios
- Operating expense budget by cost category with fixed, variable, and per-pad inputs
- Construction draw schedule and interest capitalization engine
- Debt structure: construction loan interest-only period, permanent take-out financing, and amortization
- Depreciation and deferred tax calculation (land vs. improvements)
- Unlevered and levered monthly cash flow statements, investor returns (IRR, equity multiple, MOIC)
- Direct capitalization exit valuation and scenario manager for occupancy, rent growth, cap rate, and construction timeline
Common modeling mistakes
- Assuming all pads lease up instantly, ignoring absorption timeline – early-year net operating income is overstated by 30–50%, and projected payback period shortens by 1–2 years.
- Neglecting home turnover friction and re-marketing downtime – stabilized occupancy is overstated by 5–10%, causing exit value to be inflated by 8–12%.
- Modeling utility revenue as full recovery without uncollectible portions or seasonal losses – net utility margin is overstated by 10–15%, understating true operating expense burden.
- Applying a single average cap rate without stress scenarios – exit valuation can be mispriced by 15–25%, distorting investor IRR by 3–5 percentage points.