Passenger Railway Car Plant Financial Model
Description
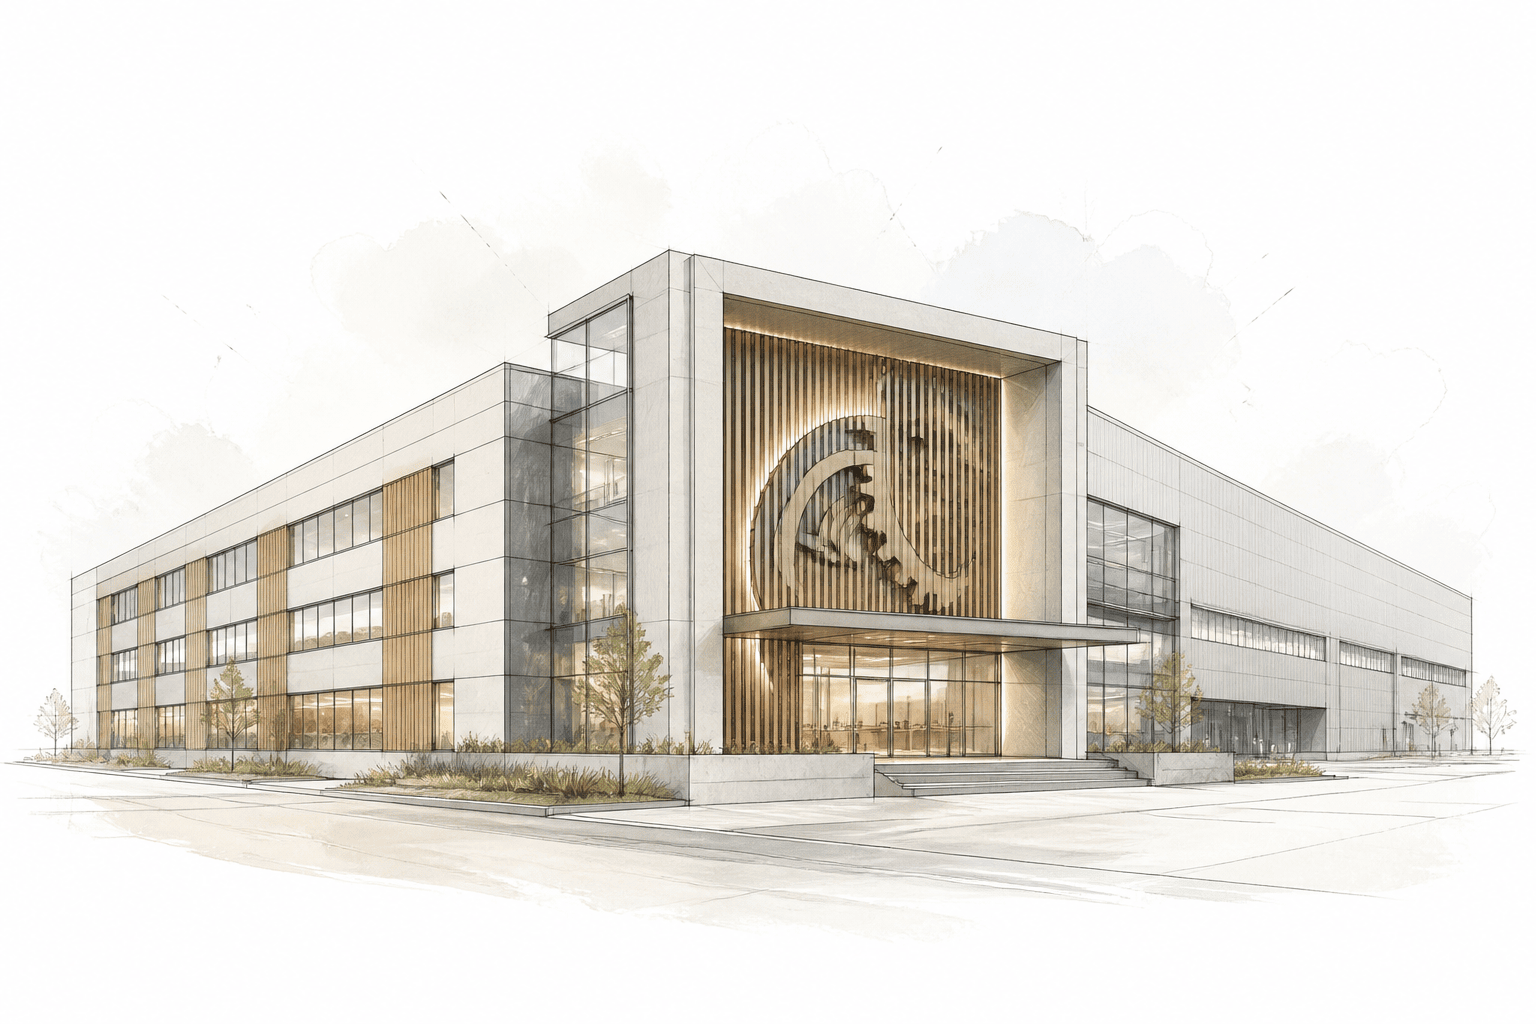
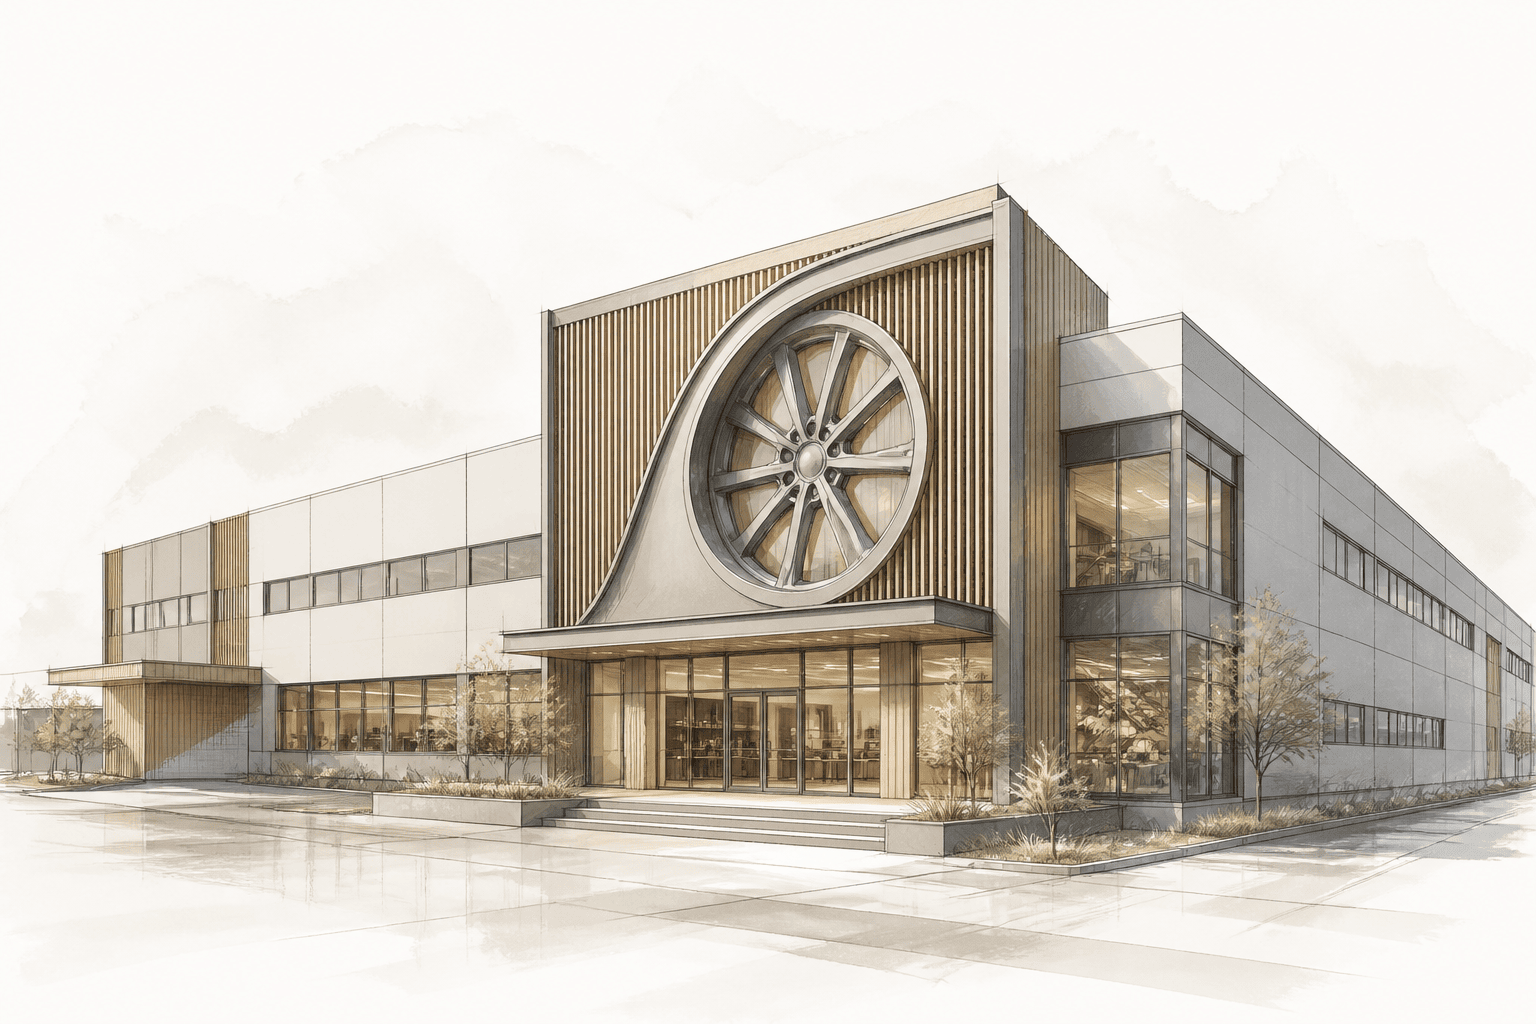
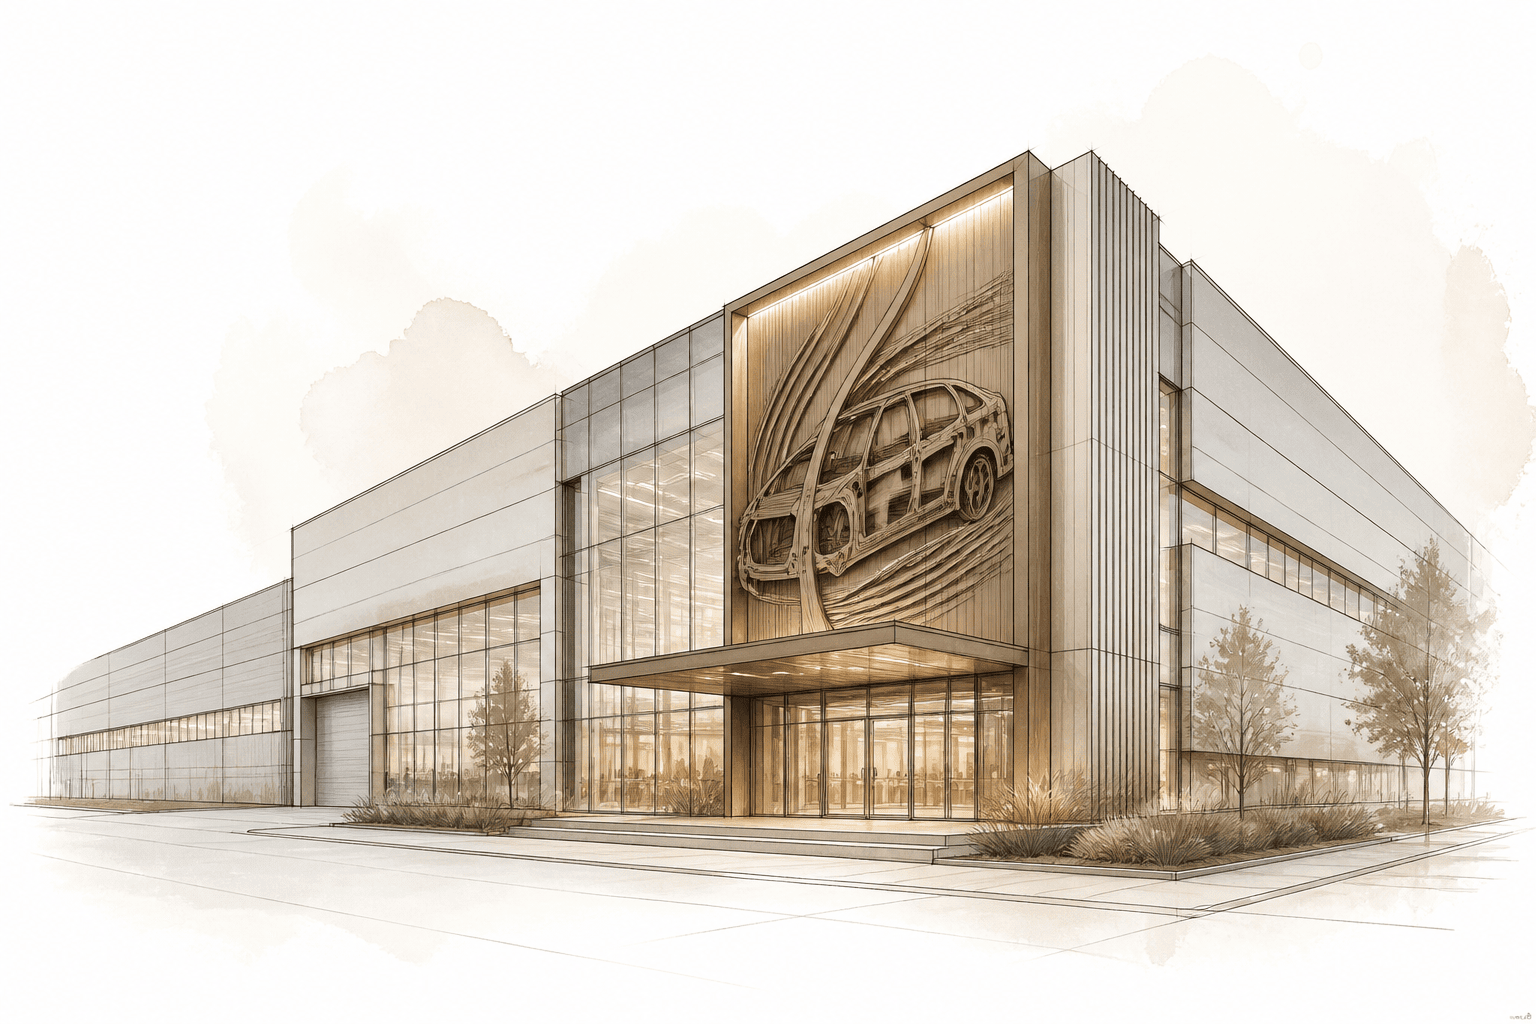
The financial model covers a full-cycle passenger railway car manufacturing plant, from carbody shell fabrication to final assembly, painting, and testing. The total investment for such a facility typically runs into several hundred million dollars, driven by specialized equipment like robotic welding lines, CNC machining centers, and an on-site dynamic test track.
The model accommodates multiple product families — electric multiple units (EMU), diesel multiple units (DMU), metro cars, or high-speed trains — each with distinct Bills of Materials (BOM) and production cycles. This allows users to evaluate the economics of a mixed product portfolio or a single-model dedicated line.
A core element is the multi-year, firm-and-option order book, a hallmark of the rail industry. The model captures the financial impact of tender wins, framework contracts with transit authorities, and the resulting backlog visibility. It translates a lump-sum contract into a detailed milestone-based payment schedule (advance, design approval, material procurement, delivery, acceptance).
The plant’s production system is modeled as a sequence of key workstations (carbody welding, painting, interior fit-out, bogie marriage, static & dynamic testing). Realistic ramp-up is simulated over 18–36 months, with a learning curve that reduces per-unit labor hours as cumulative output grows. Capacity bottlenecks, such as test track throughput and paint shop cycle time, are explicitly monitored.
Given the industry’s mandatory homologation and certification (Tier-1 safety, fire standards, electromagnetic compatibility), the model includes a detailed regulatory timeline. Delays in obtaining type approval directly push back revenue recognition and can trigger penalties, all of which are automatically reflected in cash flow.
On the cost side, the model breaks down the BOM into thousands of line items, distinguishing imported content (traction inverters, brake systems, couplers) from locally sourced components. This enables scenario analysis of local-content requirements, import duties, and FX exposure. Parallel cost structures for warranty provisioning and after-sales maintenance contracts are also built in.
The financial statements track the substantial working capital tied up in long-lead items, progress payments, and retention receivables that are typical of rolling stock contracts. This reveals the true cash profile of the business, which often differs sharply from a simple P&L view due to the backloaded nature of customer payments and the front-loaded need for materials.
Modeling specifics
- Production ramp-up modeled via a learning curve with a user-defined plateau period — avoids overstating early-year output and understating unit costs.
- Multi-product BOM with distinct labor hours and material costs per car type; automatic BOM explosion based on the production plan.
- Milestone-based payment schedule linked to actual progress (design, procurement, delivery) — prevents unrealistic cash inflows from simple percent-of-completion.
- Dynamic test track capacity constraint — a bottleneck that caps the maximum monthly factory output, often underestimated in generic models.
- Full homologation timeline with gate reviews, type tests, and certification delays — revenue is blocked until approvals are secured, directly impacting cash breakeven.
- Warranty provision model tied to delivered fleet size and historical defect rates, with a dedicated balance-sheet reserve.
- Separate tracking of imported content (HS codes) and local supply, with scenarios for tariff changes and local-content escalation.
- Detailed CapEx phasing for civil works, equipment installation, and commissioning — including capitalized interest during construction.
- Working capital simulation for retention money, advance payments, and inventory of long-lead components — reveals the true liquidity demand.
- Crew and shift modeling for each workstation, including indirect labor for QA, maintenance, and engineering — avoids underestimating overheads.
- Scenario manager for order book variations (firm orders vs. options), production rates, and learning curve steepness — one-click stress-testing.
- Maintenance & service agreement module for the aftermarket, with revenue linked to fleet operating hours and a separate cost structure.
What's included in the base version
- Integrated three-statement financial model (P&L, Balance Sheet, Cash Flow) with monthly granularity.
- CapEx schedule with multiple asset categories, depreciation, and cash flow waterfall.
- Debt and financing module with flexible drawdowns, repayments, and covenant tracking.
- Order book manager with multi-year contracts, milestones, and retention logic.
- Production model with BOM, labor, machine-hour rates, and capacity constraints.
- Operating expense forecast, split into fixed and variable, with indirect staffing.
- Tax and transfer pricing module for multi-jurisdiction setups (if applicable).
- Investment metrics (NPV, IRR, payback) and sensitivity/scenario analysis.
- Warranty provision calculator linked to deliveries.
- Working capital model (receivables, payables, inventory) driven by contract terms.
- Dynamic dashboard with output, financial, and operational KPIs.
Common modeling mistakes
- Assuming a full-rate production from month one instead of an 18–24 month ramp-up — overstates Year 1 output by 30–50% and understates cumulative cash requirements by 25–35%.
- Ignoring homologation testing and certification delays — pushes revenue recognition back by 2–4 quarters, delaying cash breakeven by 12–18 months.
- Modeling all payments as cash-on-delivery without milestone structure — misses that only 10–15% is received at signature and 5–10% retained, overstating early cash inflow by 40–60%.
- Using a static BOM cost without separating imported high-tech components from local steel — misses 8–15% cost escalation risk from FX and tariff changes over the contract period.
- Treating warranty costs as a flat percentage of revenue rather than aging the delivered fleet — understates warranty reserve by 1.5–2x and leads to cash outflow surprises in later years.