Surf Park with Artificial Wave Pool Financial Model
Description
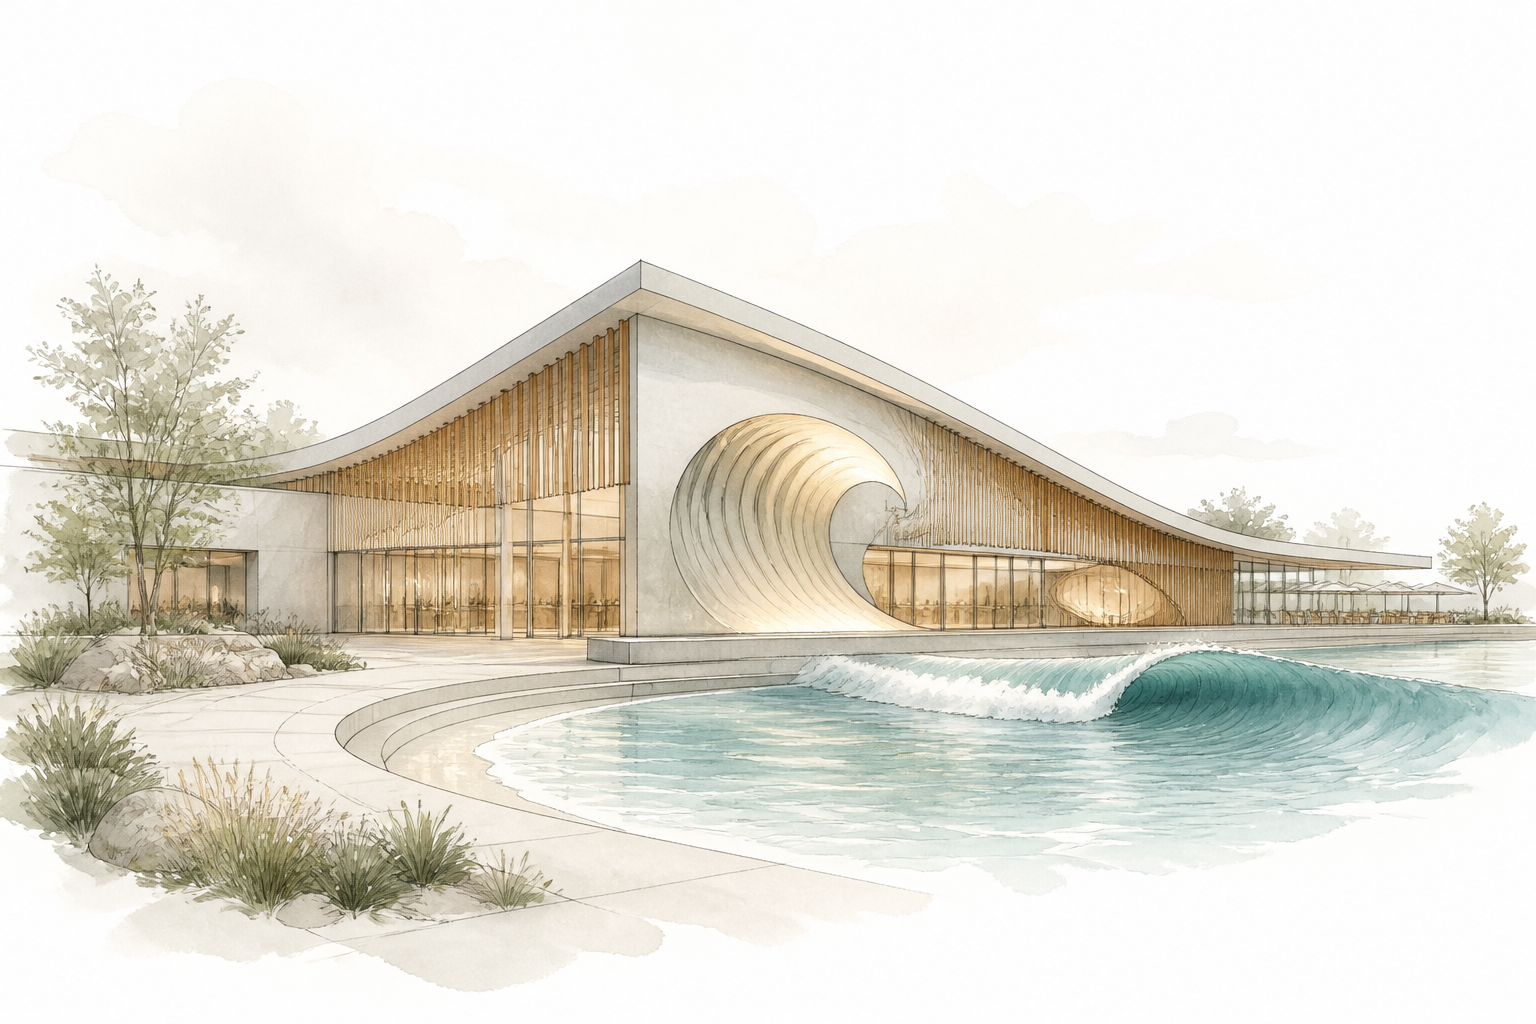
The model captures the entire operation of a destination surf park built around an artificial wave pool. It starts from the selection of wave generation technology—pneumatic, hydrodynamic, or mechanical—and translates technical specifications (waves per hour, riders per wave, power factor) into a full operational P&L. The capital-intensive nature of the project, with investments often reaching tens of millions of dollars for land, lagoon construction, and machinery, is reflected in the phased construction engine and asset-level depreciation schedules.
On the revenue side, attendance is not taken as a single daily figure; the model breaks it into hourly surf sessions, each with a specific wave type and skill level (beginner reef, intermediate, advanced point break). Revenue streams include pay-per-session passes, membership subscriptions, multi-session packs, professional coaching, equipment rental, as well as ancillary spending on F&B, retail, and event income. The interplay between public access and premium private slots is fully modeled, showing how pricing decisions affect utilization and average revenue per wave.
Costs are dominated by electricity to run the wave machine, which can account for a quarter to a third of operating expenses. The model goes beyond a simple average kWh cost: it incorporates peak demand charges, time-of-use rates, and the power curve of the chosen wave device. Other significant cost blocks—water treatment, heating (if indoor), staffing proportional to water area and active surfers, and a wave-count-driven maintenance reserve—are all built in with true operational logic, not generic percentages.
The financial model is designed to test feasibility under multiple scenarios: a change in wave technology, a delay in construction phases, an energy crisis spiking power prices, or a membership mix shift. It produces integrated financial statements, a flexible debt/equity waterfall, and a scenario manager that immediately shows the impact on cash flows and returns. For developers considering a phased rollout or a supplementary accommodation component, the base model provides the core surf park engine, ready to be extended with the modules available as additional options.
Modeling specifics
- Wave machine power modeling: separate consumption profiles for idle, generating small waves, and large waves; includes demand charge calculation based on peak draw.
- Attendance granularity: daily capacity is not a fixed number but a function of daylight hours, wave schedule, surfer rotation time, and beginner vs. advanced session mix.
- Weather-driven seasonality: monthly attendance indices derived from historical climate data (wet days, temperature), directly scaling revenue and variable staff.
- Beginner learning-curve impact: in early years, throughput per wave is reduced because novices catch fewer waves, modeled via a 'beginner efficiency' factor that improves over time.
- Energy tariff scenarios: ability to switch between flat rates, time-of-use, and industrial demand-based tariffs to evaluate optimal energy procurement strategy.
- Maintenance reserve: a dedicated fund built from per-wave contributions, with major overhaul expenditure triggered automatically after a set number of wave cycles.
- Membership and recurring revenue logic: models monthly/annual memberships with churn, freeze options, and cross-usage of wave slots versus walk-in capacity.
- Phased construction: supports multiple independent phases (lagoon only, then hotel, then second lagoon) with staggered Capex and revenue ramp-up.
- Staff scaling by water zone: lifeguards per defined water area, instructors per active surfer, automatic scheduling for peak/off-peak.
- Revenue cannibalization analysis: shows trade-off between high-price private coaching sessions and public sessions occupying the same wave slots.
What's included in the base version
- Capex schedule with wave machine, lagoon, clubhouse, and infrastructure
- Wave plant operations: energy consumption (peak/off-peak), maintenance cycles, depreciation
- Hourly attendance model with seasonal adjustment and surf skill tiers
- Revenue streams: wave sessions (pay-per-session, multi-packs), memberships, lessons, equipment rental
- Staffing model tied to active surfers and water area
- Simplified F&B and retail revenue (percentage of attendance)
- Integrated financial statements (monthly P&L, cash flow, balance sheet)
- Debt & equity financing with construction drawdowns
- Scenario manager for wave technology and pricing assumptions
- Sensitivity tables on key drivers (energy cost, attendance, Capex)
Common modeling mistakes
- Overlooking peak demand charges and time-of-use electricity rates — energy costs underestimated by 25–40%, making the project’s payback period appear 1.5–3 years shorter than reality.
- Assuming constant year-round daily attendance without weather or seasonal index — annual revenue overstated by 15–30%, with a corresponding overestimation of peak capacity utilization.
- Using an optimistic surfer-per-wave and rotation speed that ignores beginner inefficiency — effective capacity in early years overestimated by 20–30%, leading to inflated throughput and revenue.
- Neglecting the maintenance reserve tied to cumulative wave cycles — a sudden cash outflow of 5–10% of wave equipment Capex in year 4–6, not reflected in the P&L, creates a liquidity gap.
- Treating staff costs as a simple % of revenue instead of linking lifeguards and instructors to active water zones and session load — payroll underestimated by 15–25% during peak hours, distorting operating leverage.