CT Center Network Financial Model
Description
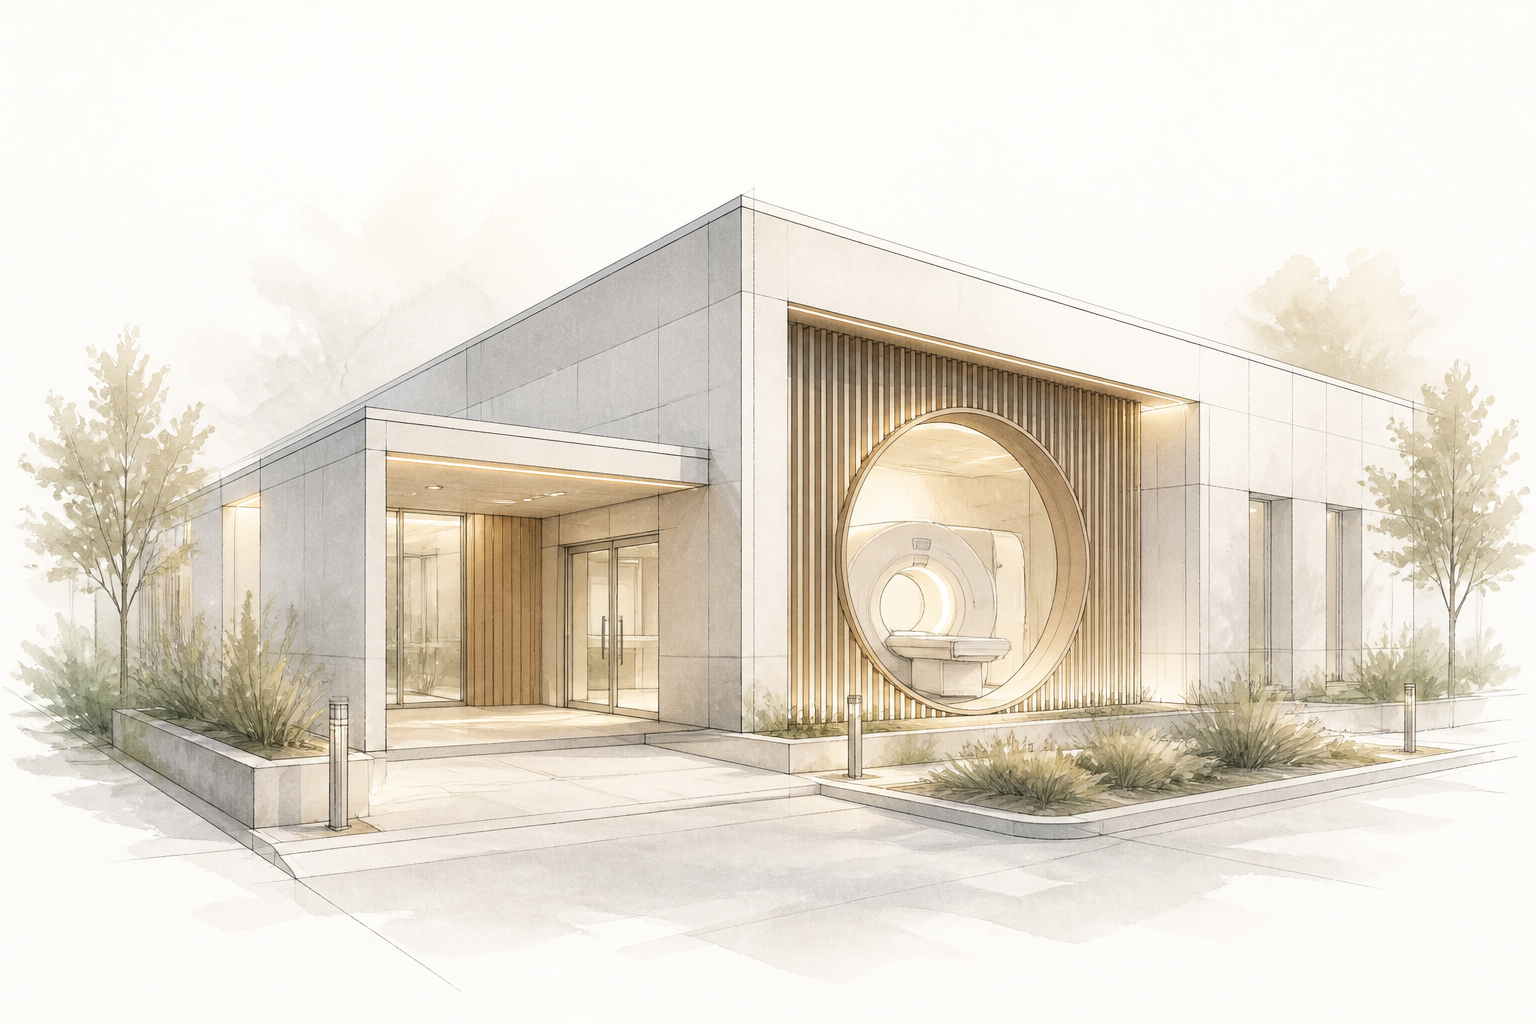
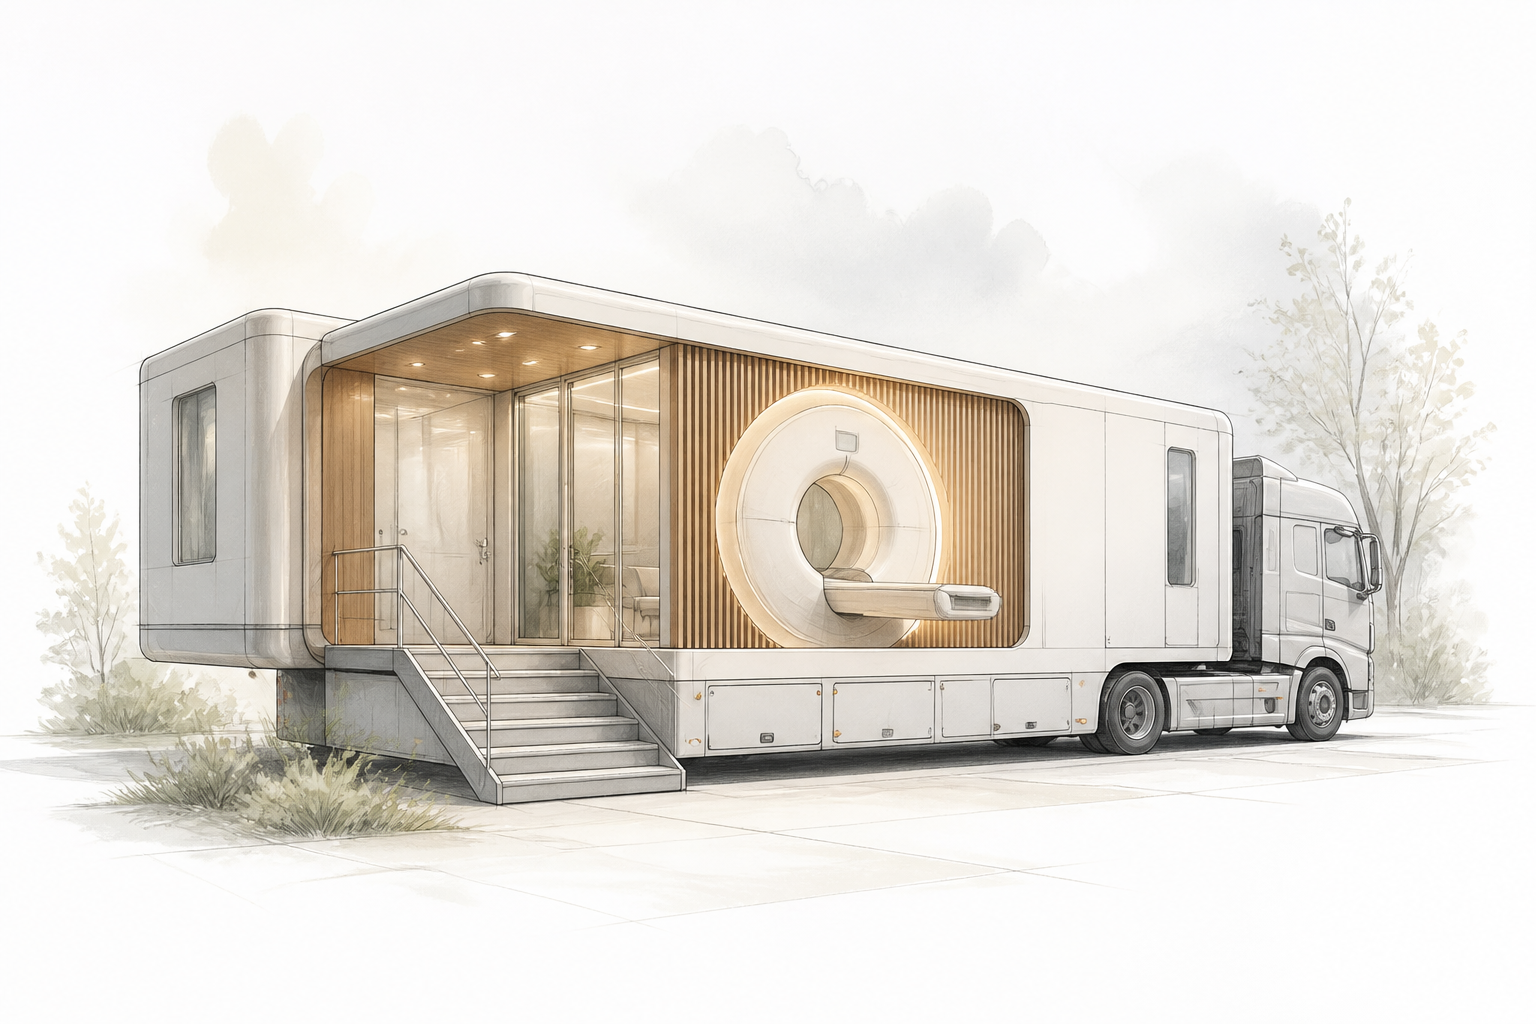
The model is designed for planning, financing, and operating a network of CT imaging centers under a single ownership or management group. It supports an unlimited number of locations, each with its own timeline, scan modalities, patient catchment, and cost structure, while consolidating performance at the network level to capture economies of scale and portfolio effects.
Revenue generation is decomposed into patient streams by referral source (physician groups, emergency departments, walk-in, direct-to-consumer), with adjustable reimbursement rates per payor (commercial, Medicare, Medicaid, self-pay) and realistic collection curves that reflect lag and bad debt. Capacity modeling captures scan slots per machine, seasonal and intra-week demand variation, machine downtime, and no‑show rates, ensuring utilization forecasts are grounded.
CapEx planning covers CT scanner procurement (including life‑cycle replacement every 7–10 years), facility build‑out or leasehold improvements, IT infrastructure, and ancillary equipment. The model transparently tracks service contracts, which typically evolve from 6–10% of initial equipment cost per year and escalate with age, avoiding the common pitfall of fixed maintenance assumptions.
Financing is structured around multiple debt and lease instruments, equity injections, and cash flow sweeps. The model calculates project and equity IRRs, DSCR, LLCR, payback, and net present value. An assumptions dashboard and sensitivity tables let users instantly gauge the impact of changes in referral volumes, reimbursement rates, equipment costs, or ramp‑up speed on key metrics. Total investment for a network of this type usually ranges from tens of millions to over a hundred million dollars depending on the number and configuration of centers; the model serves as an order‑of‑magnitude tool, not a final valuation.
Modeling specifics
- Multi‑center architecture with individual center activation: each site has its own start month, ramp‑up curve (J‑shaped, not linear), and modality mix; the model automatically consolidates financials and flags cross‑center interdependencies like referral cannibalization.
- Equipment lifecycle manager: each CT scanner is tracked from acquisition through replacement, with granular service contract modeling that escalates by age and links to manufacturer‑specific maintenance tiers; downtime during replacement is built into capacity loss.
- Patient flow engine with minute‑level scheduling dynamics: scan slots per hour, machine‑days per week, seasonal indices, and day‑of‑week patterns combine to produce realistic daily volumes that can be stress‑tested for wait times and overtime costs.
- Payor contract blending: separate input sheets for up to 8 payor classes per center, each with its own fee schedule (technical and professional components), contractual adjustments, and collection timing; the model automatically computes net revenue per scan and bad debt provisions.
- Staffing module that respects credentialing and licensing: radiologist productivity in RVUs or reads per shift, technologist‑to‑scanner ratios, and administrative overhead scale non‑linearly with patient volume; supports full‑time, part‑time, and teleradiology models with shift differentials.
- Integrated financing: multiple debt tranches with bullet, amortizing, or sculpted repayment; lease accounting; vendor financing; interest‑only periods; and DSCR/LLCR covenants that trigger cash sweeps or default flags.
- Tax depreciation with bonus/accelerated options and deferred tax modeling, switchable between straight‑line and MACRS conventions, reflecting real‑world cash flow timing.
- Scenario manager embedded in the base model: toggle between base, conservative, and aggressive cases for key drivers (referral growth, reimbursement rates, equipment cost, construction delay) without altering model structure.
- Inter‑center shared service allocation: central marketing, billing, and administrative costs are distributed according to scan volume, revenue, or headcount, preventing over‑ or under‑allocation.
- Dynamic summary dashboard with waterfall charts, utilization heatmaps, and breakeven analysis per center.
What's included in the base version
- Multi-center consolidation: P&L, cash flow, balance sheet for each center and consolidated network
- Revenue model: scan volume by modality and center, payor mix, reimbursement rates, collection curves, bad debt
- Capital expenditure plan: scanner procurement, facility fit-out, IT, phased rollout schedule
- Operating expenses: staff salaries (by role and center), consumables, service contracts, rent, utilities, marketing, insurance
- Equipment lifecycle: acquisition, replacement cycles, maintenance cost escalation, residual values
- Staffing engine: technologist, radiologist, admin and support staff per center, with shift patterns
- Debt and lease financing: multiple facilities, sculpted repayment, interest, covenant tests
- Tax calculation: income tax, deferred tax, depreciation schedules (straight-line and MACRS)
- Financial outputs: project IRR, equity IRR, NPV, payback, DSCR, LLCR, cash-on-cash return
- Assumptions dashboard: all key inputs centralized and documented
- Sensitivity tables on scan volume, price, staff cost, and equipment cost
- Monthly and annual timelines with dynamic center activation dates
Common modeling mistakes
- Applying a single reimbursement rate and ignoring payer mix — inflates net revenue per scan by 20–35% if the actual major payor is not commercial.
- Assuming flat monthly patient flow without seasonality or day-of-week patterns — overestimates annual scan volume by 10–20%, leading to overstated revenue and capacity needs.
- Using linear center ramp-up from 0% to 100% over 12 months — real‑world ramp follows a concave curve; linear assumption overestimates first‑year revenue by 30–50%.
- Fixing service contract cost at a flat percentage of initial CapEx — actual contracts escalate with age and inflation; ignoring escalation understates maintenance opex by 15–25% in years 5+.
- Neglecting equipment replacement downtime — ignores 2–4 weeks of lost capacity per scanner every 7–10 years, distorting cash flow timing and replacement CapEx.
- Excluding bad debt and contractual write‑offs — overstates net collections by 5–15% of gross charges, especially for self‑pay and high‑deductible plans.