Low-dose CT Lung Cancer Screening Center Financial Model
Description
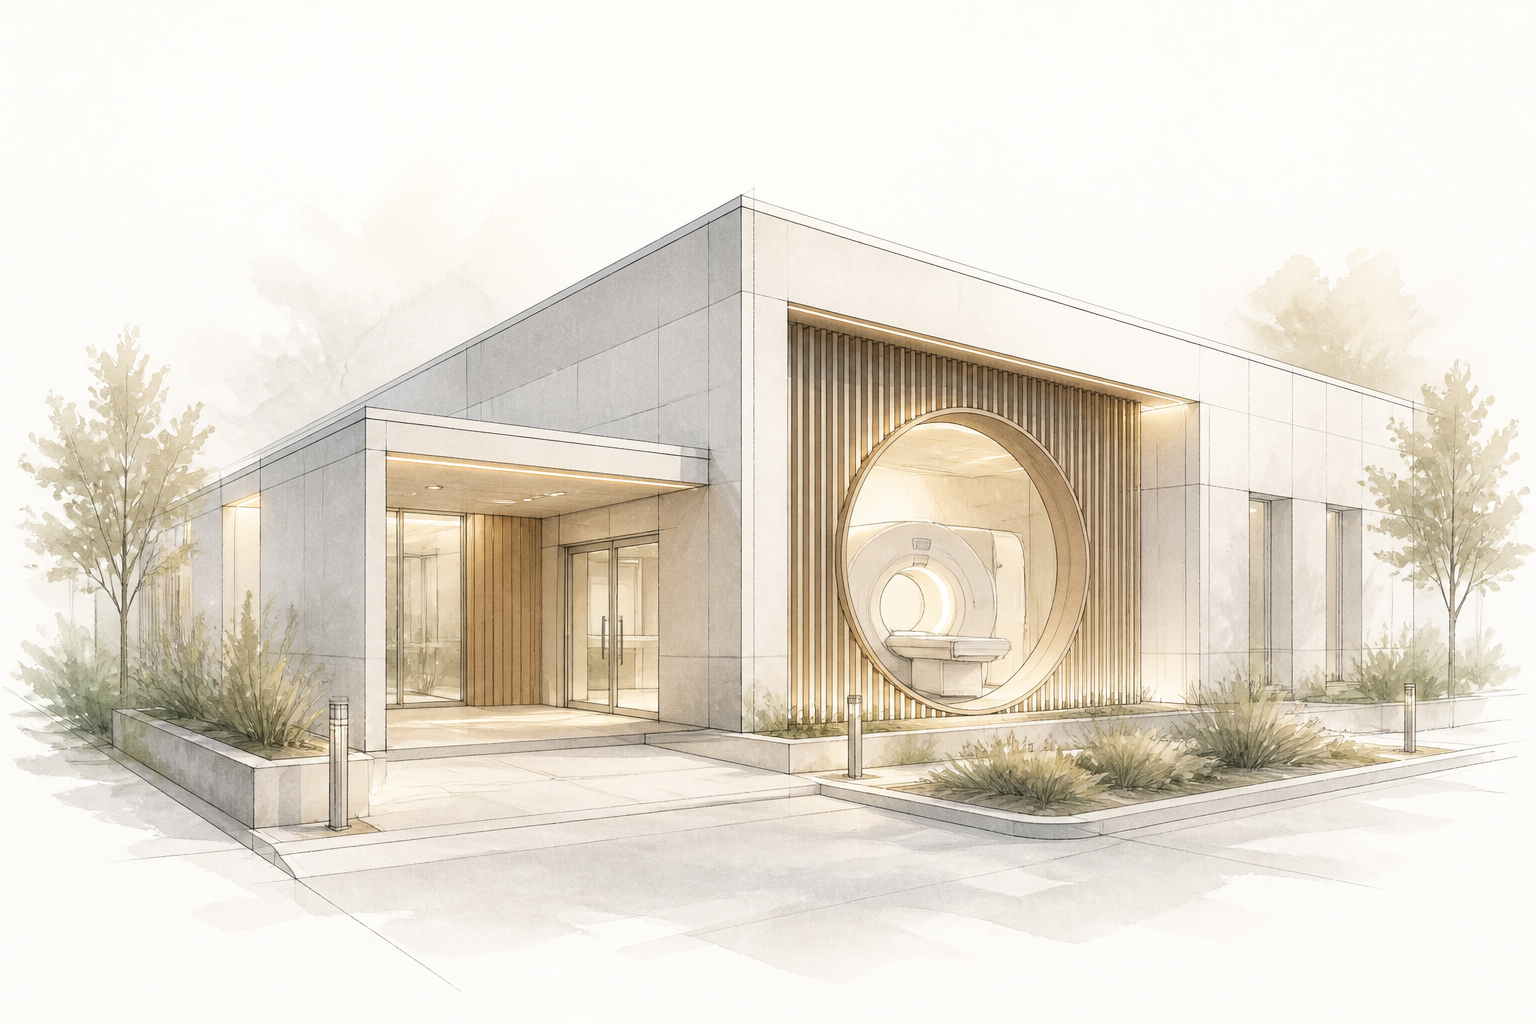
Low-dose CT lung cancer screening centers serve high-risk populations through annual exams, following guidelines such as USPSTF. This model covers both fixed-site and mobile operations, mapping the entire patient journey from acquisition and scheduling to scan, radiologist reporting, and recall tracking. It splits patient pathways into initial screening and diagnostic follow-up after a positive finding, each with its own billing, capacity, and revenue logic.
Operationally, the model captures scan-slot throughput with realistic allowances for room turnover, scheduled preventive maintenance, no-show rates, and seasonal demand variations. The false-positive recall rate (inherent in LDCT screening) is modeled as a dynamic driver that generates downstream diagnostic CT volumes, incremental professional fees, and associated resource consumption – making the interplay between screening accuracy and center profitability transparent.
The capital structure includes the CT scanner (purchase or finance lease), radiation shielding, IT/PACS, and facility build-out. Operating costs are detailed: radiographer shifts, radiologist contracts (in-house or teleradiology), service agreements treated as a time-varying percentage of equipment cost, and ACR/MQSA compliance. The model indicates the investment magnitude at a medium-scale level, offering an indicative order of magnitude rather than a final budget.
Modeling specifics
- Separate patient pathways for screening and diagnostic follow-up, each with distinct CPT codes, payer-specific reimbursement rates, and resource consumption patterns.
- Payer mix blending (Medicare, Medicaid, commercial, self-pay) with collection lag, bad debt, and contractual adjustments to build a net revenue waterfall.
- Capacity engine based on scan duration, room cleaning time, preventive maintenance downtime, radiologist reading slots, and seasonal volume indices, preventing overstatement of utilization.
- Auto-computed false-positive recall rate, translating baseline positivity into additional diagnostic CTs, PET-CT referrals, and biopsy procedures, with full revenue and cost attribution.
- Service contract cost dynamically linked to scanner acquisition value, escalating over time with inflation and multi-year extension options, avoiding a fixed-cost trap.
- Staffing ramp with position overlap, part-time fractions, training delays, and radiologist productivity curves (per-click vs. salary) to match realistic clinical hiring timelines.
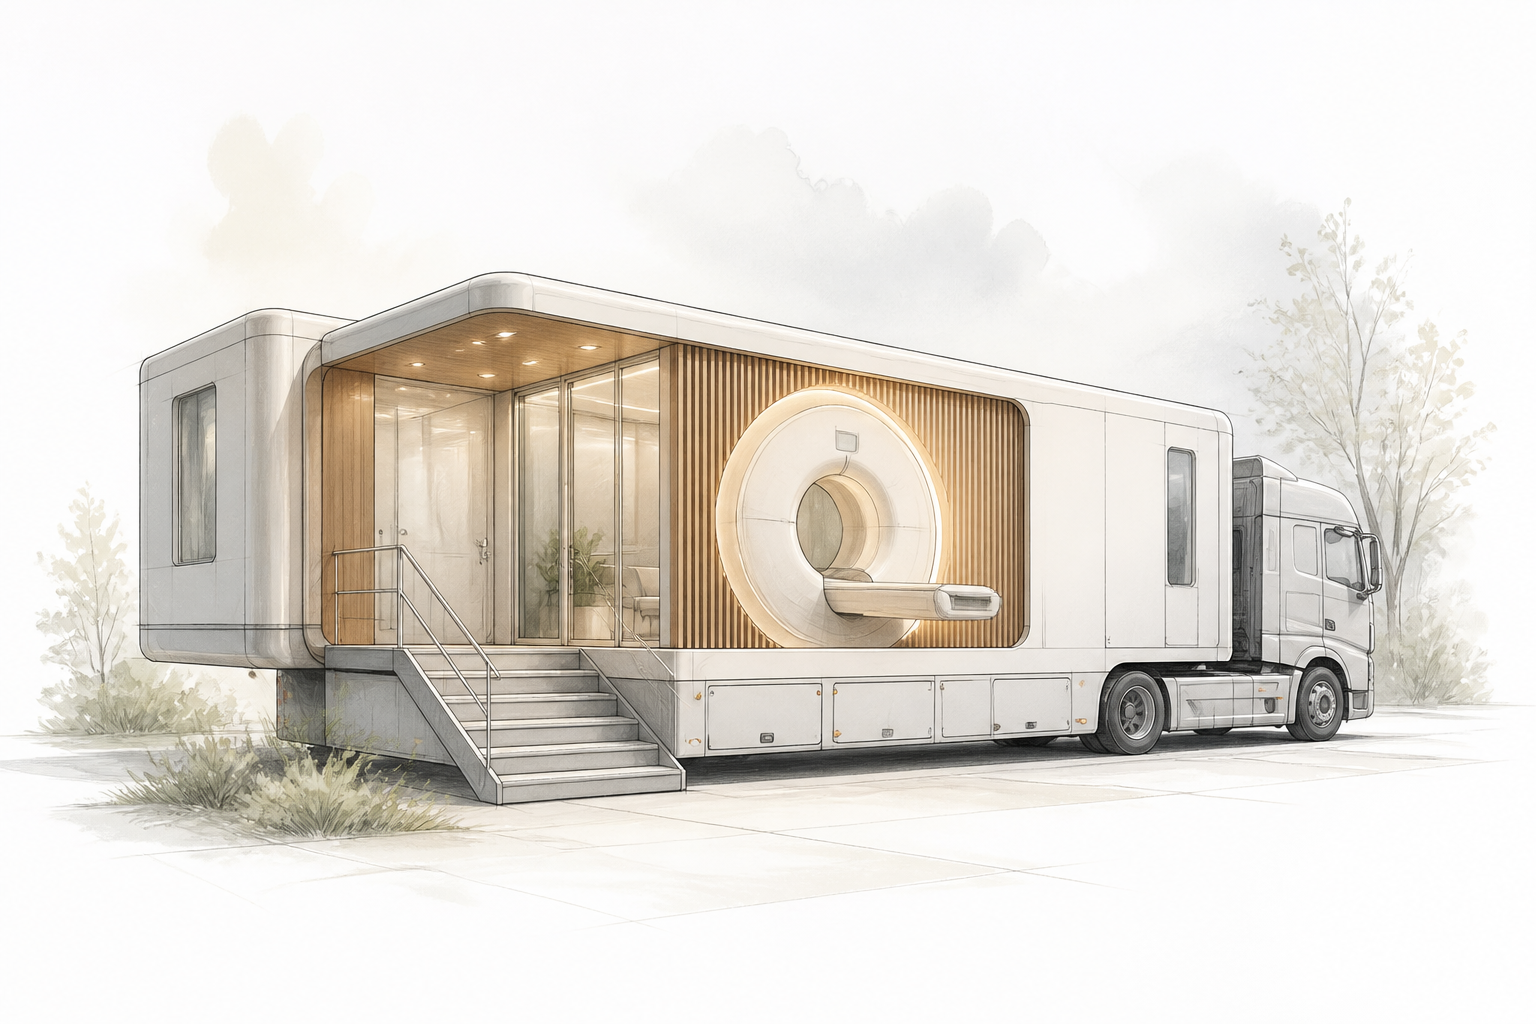
- Mobile unit add-on logic (if activated via option) that models route days, weather downtime, vehicle lease/depreciation, and incremental fuel/maintenance costs, integrated into the center's consolidated financials.
What's included in the base version
- Executive dashboard with KPI tiles (patient volume, revenue mix, margin, IRR, payback)
- Input assumptions master sheet (volume ramp, payer mix, pricing, staffing, capex phasing, debt terms)
- Patient flow and capacity calculator (screening + follow-up CT slots, radiologist reading capacity)
- Revenue model by service type and payer, including net revenue and collection schedules
- Operating expense schedule (salaries, benefits, rent, medical supplies, G&A, compliance costs)
- Capital expenditure and depreciation schedule (build-out, CT scanner, IT/PACS, furniture, initial supplies)
- Staffing plan with FTE build-up, shift patterns, and payroll taxes/benefits
- Financing module (term loan and equity injection with waterfall)
- Integrated financial statements (monthly and annual P&L, cash flow, balance sheet)
- Investment analysis (unlevered and levered IRR, NPV, payback, MOIC)
- Sensitivity tables on volume, average reimbursement, scanner uptime, and staffing costs
- Scenario manager with base, best, and worst case presets
Common modeling mistakes
- Ignoring false-positive recall rate and failing to link positive screens to diagnostic follow-up CTs — screening revenue overshoots by 15–25% while downstream service demand is missed, distorting both top line and capacity planning.
- Omitting the annual service contract cost or treating it as a fixed dollar amount — total opex is understated by 10–15% over the equipment lifecycle, leading to an overly optimistic EBITDA.
- Assuming 100% scanner uptime without scheduled preventive maintenance and room cleaning buffers — overstates annual scan capacity by 25–30% and underestimates staffing needs.
- Applying a uniform reimbursement rate for all CT exams instead of differentiating screening (G0297) from diagnostic follow-up (71271) — causes a net revenue miscalibration of 20–40%.
- Not modeling radiologist reading capacity as a bottleneck — inflates patient throughput projections by 10–20%, hiding the need for teleradiology or additional FTE costs.
- Underestimating the timeline for credentialing, payer enrollment, and radiation safety approvals before the first patient scan — extends the cash flow break-even point by 6–12 months relative to engineering-driven projections.