CT Suite Financial Model
Description
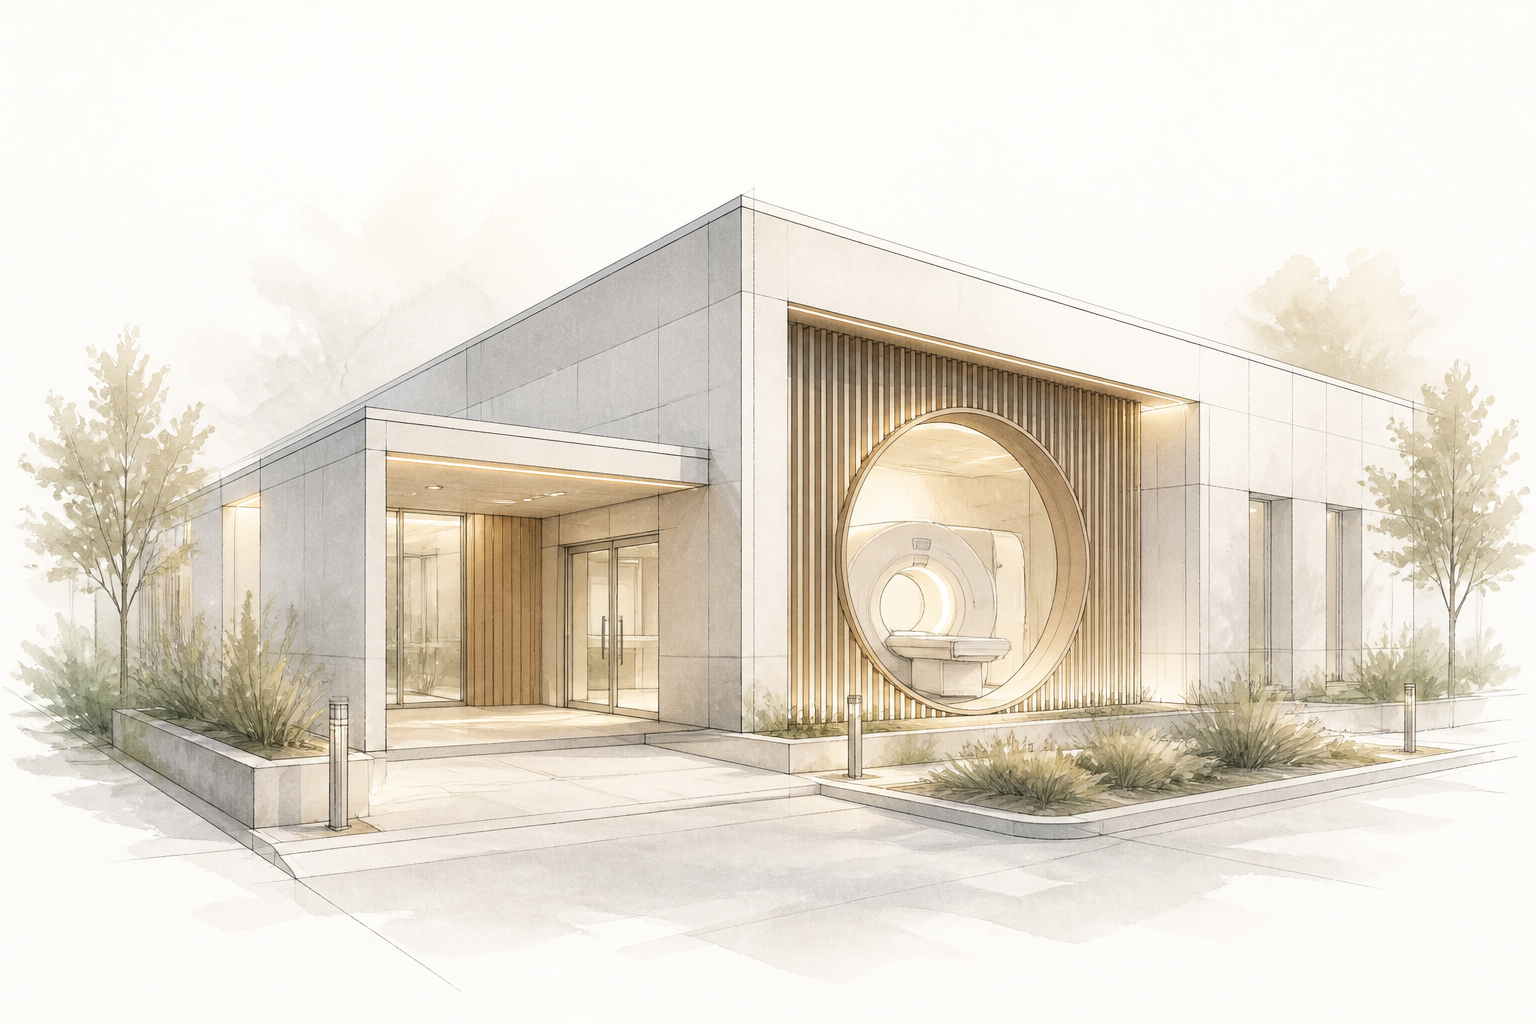
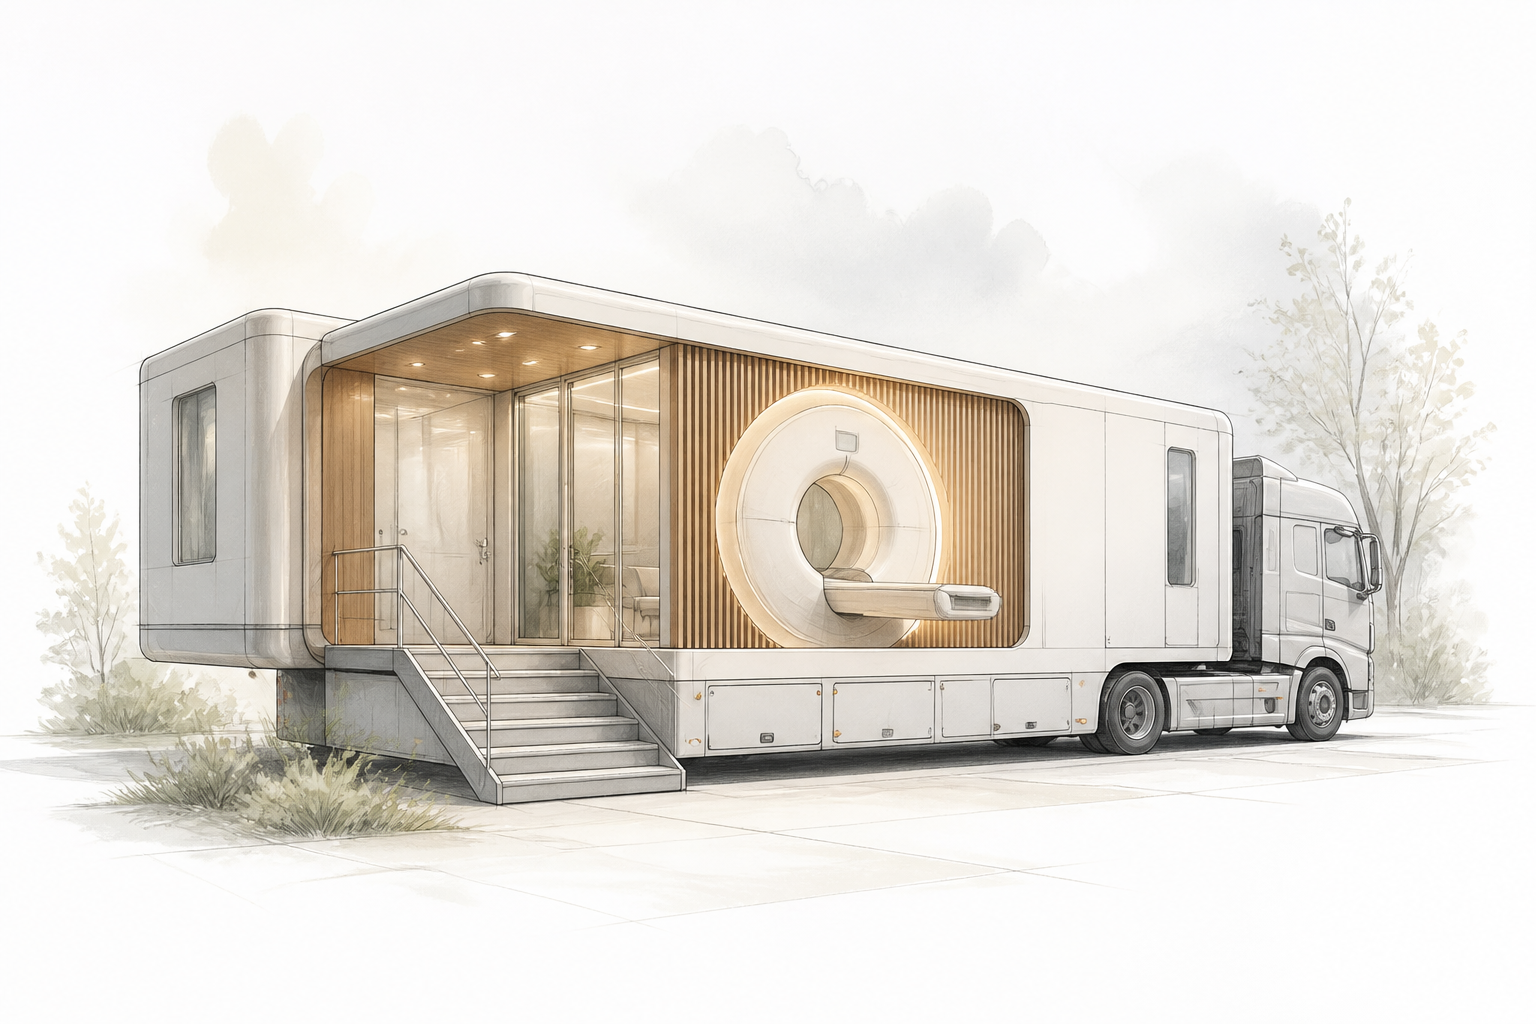
This model is built for a diagnostic imaging business centered around one or more CT scanners — a capital-intensive outpatient service with high fixed costs and per-scan revenue. It captures the real-world complexity of running a CT suite, whether independent, inside a medical office building, or as a hospital-affiliated unit. Revenue is driven by patient volume, scan mix (head, chest, abdomen/pelvis, angiography, etc.), contrast usage, and the payor landscape, not by a single average ticket.
Operationally, the model reflects how CT capacity is shaped by time: scan duration, room turnaround, contrast protocols, and shift patterns. It accounts for the hard constraints of a fixed number of scanner hours, building in realistic ramp-up curves as referral relationships develop. Staffing covers front-desk, technologists per scanner per shift, and radiologist reads—either in-house or outsourced, with fees per exam. Equipment life is modeled through loan and lease modules, with a separate reserve for X‑ray tube replacements tied to scan counts.
On the cost side, construction, lead‑lined shielding, licensing, and IT infrastructure are broken out as distinct investment items. Service contracts, typically a percentage of scanner cost, are modeled with escalators. The financial outputs give an order‑of‑magnitude view of the total investment needed to open a CT suite, while allowing the buyer to stress‑test assumptions around reimbursement rates, patient flow, and equipment mix.
Modeling specifics
- Shift‑based patient flow with time slots — models the actual number of scans per day by hour and shift, using procedure duration, turnaround time, and setup for contrast/non‑contrast exams.
- Payor‑mix reimbursement modeling — separate revenue streams for Medicare, commercial insurance, worker’s compensation, and self‑pay, each with its own collection rate and payment lag.
- Equipment financing comparison — side‑by‑side capital lease, operating lease, and outright purchase with interest, depreciation, and residual value calculations; respects the true economics of acquiring a CT scanner.
- Service contract cost driver — annual contract cost as a percentage of equipment capital cost (6–10%), with break‑fix vs. comprehensive coverage options and annual inflation.
- X‑ray tube replacement reserve — a dedicated fund that accumulates per scan based on expected tube life (scan count) and replacement cost, preventing a hidden future cash crunch.
- Staffing by scanner and shift — technologist schedules tied to operating hours, with part‑time and overlap logic; radiologist cost as either a per‑exam reading fee or full‑time equivalent.
- Construction and shielding breakout — separate line items for lead‑lined walls, door interlocks, control room, and radiation safety compliance, not buried inside a generic “build‑out” figure.
- Referral ramp‑up curve — allows for a multi‑month volume build‑up, with separate control over marketing spend and its impact on scan volume growth.
- Mix of scan types with contrast cost — differentiates non‑contrast, with‑contrast, and dual‑phase protocols, each pulling contrast media and consumable costs at the per‑procedure level.
What's included in the base version
- Revenue projection — detailed by scan type, payor, and month over the project horizon.
- Patient flow schedule — shift templates, scan duration and turnaround times, daily and monthly utilization.
- Staffing plan — technologists, radiologists (in‑house or teleradiology), administrative staff, and on‑call coverage.
- Direct cost model — contrast media, medical supplies, per‑scan consumables, and patient preparation materials.
- Capital expenditure schedule — CT scanner(s), ancillary equipment, facility construction, shielding, IT, and initial licensing.
- Equipment financing module — loan, capital lease, operating lease, or purchase with full amortization and interest.
- Operating expense detail — rent, utilities, service contract, insurance, marketing, billing/collection costs, and regulatory fees.
- Three integrated financial statements — monthly profit & loss, cash flow, and balance sheet for the full projection period.
- Key metrics dashboard — payback period, net present value (NPV), internal rate of return (IRR), and break‑even volume.
- Base case scenario with toggleable inputs — change volumes, pricing, and cost assumptions without breaking formulas.
Common modeling mistakes
- Using a blended average scan price instead of individual payor rates — overestimates revenue by 15–30% because it ignores the lower effective collections from government payors.
- Modeling 100% utilization from month one — overstates first‑year scan volume and revenue by 30–50% by ignoring referral ramp‑up, no‑shows, and room turnaround losses.
- Treating contrast media as a fixed overhead — understates variable cost per contrast scan by $20–60, distorting the incremental profitability of high‑margin exams.
- Forgetting CT tube replacement cost — underestimates lifecycle equipment maintenance by 15–25%, leaving a large cash outlay unplanned in years 2–4.
- Applying the same collection timeline to all payors — artificially shortens cash conversion cycle by 15–45 days, which overstates early‑year operating cash flow.