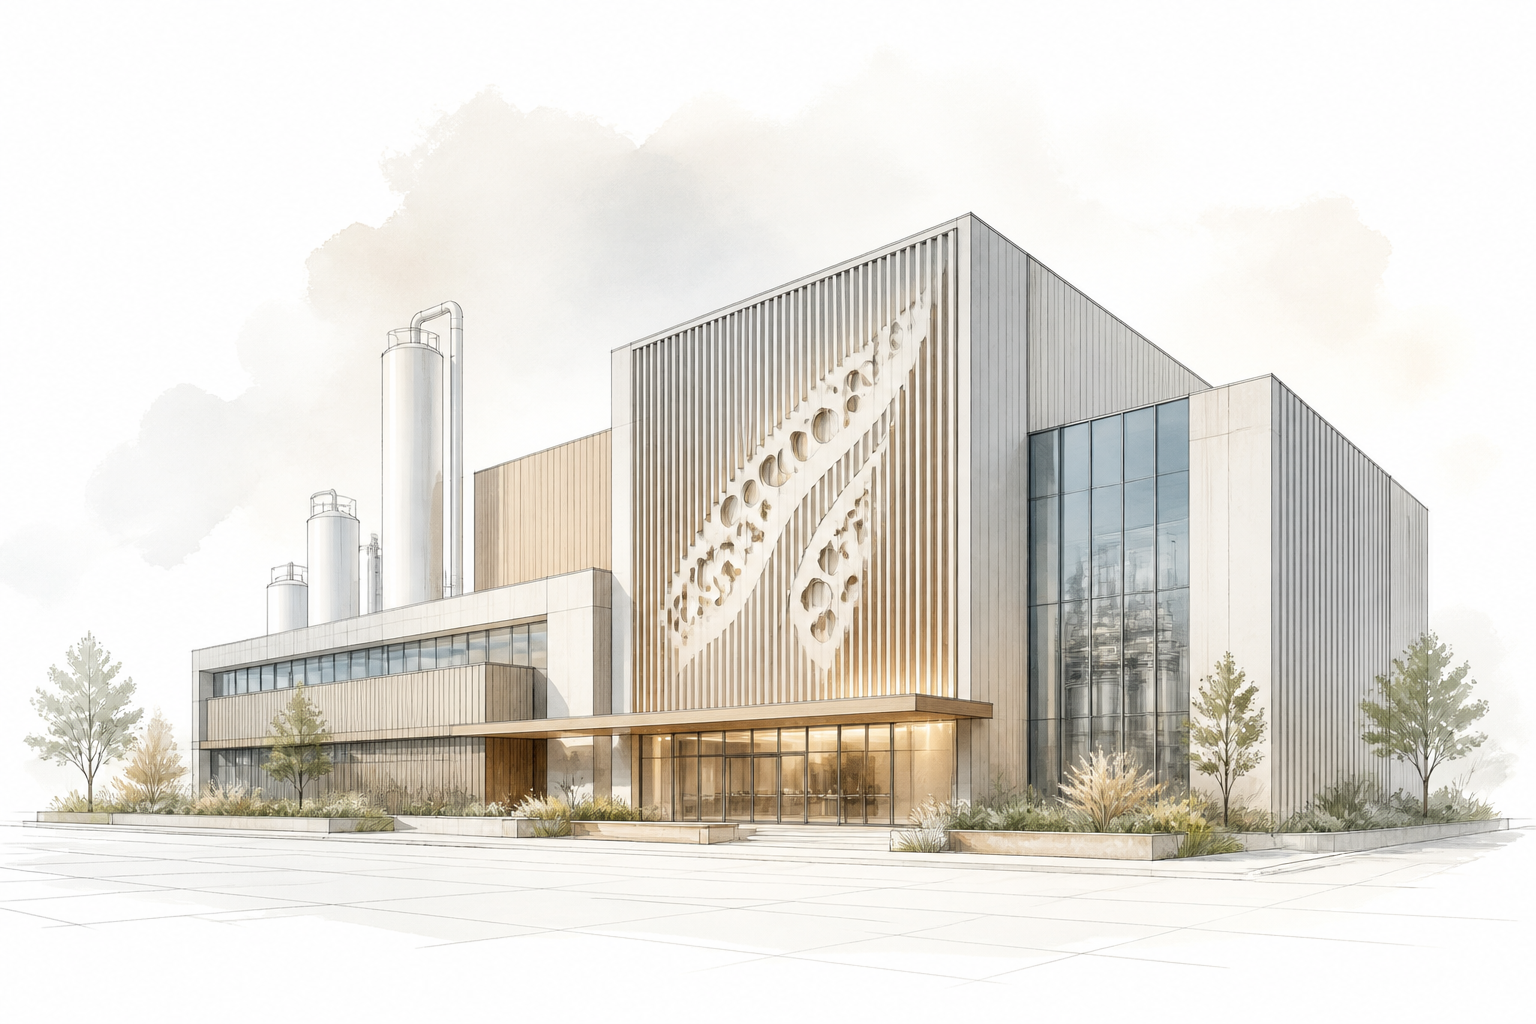
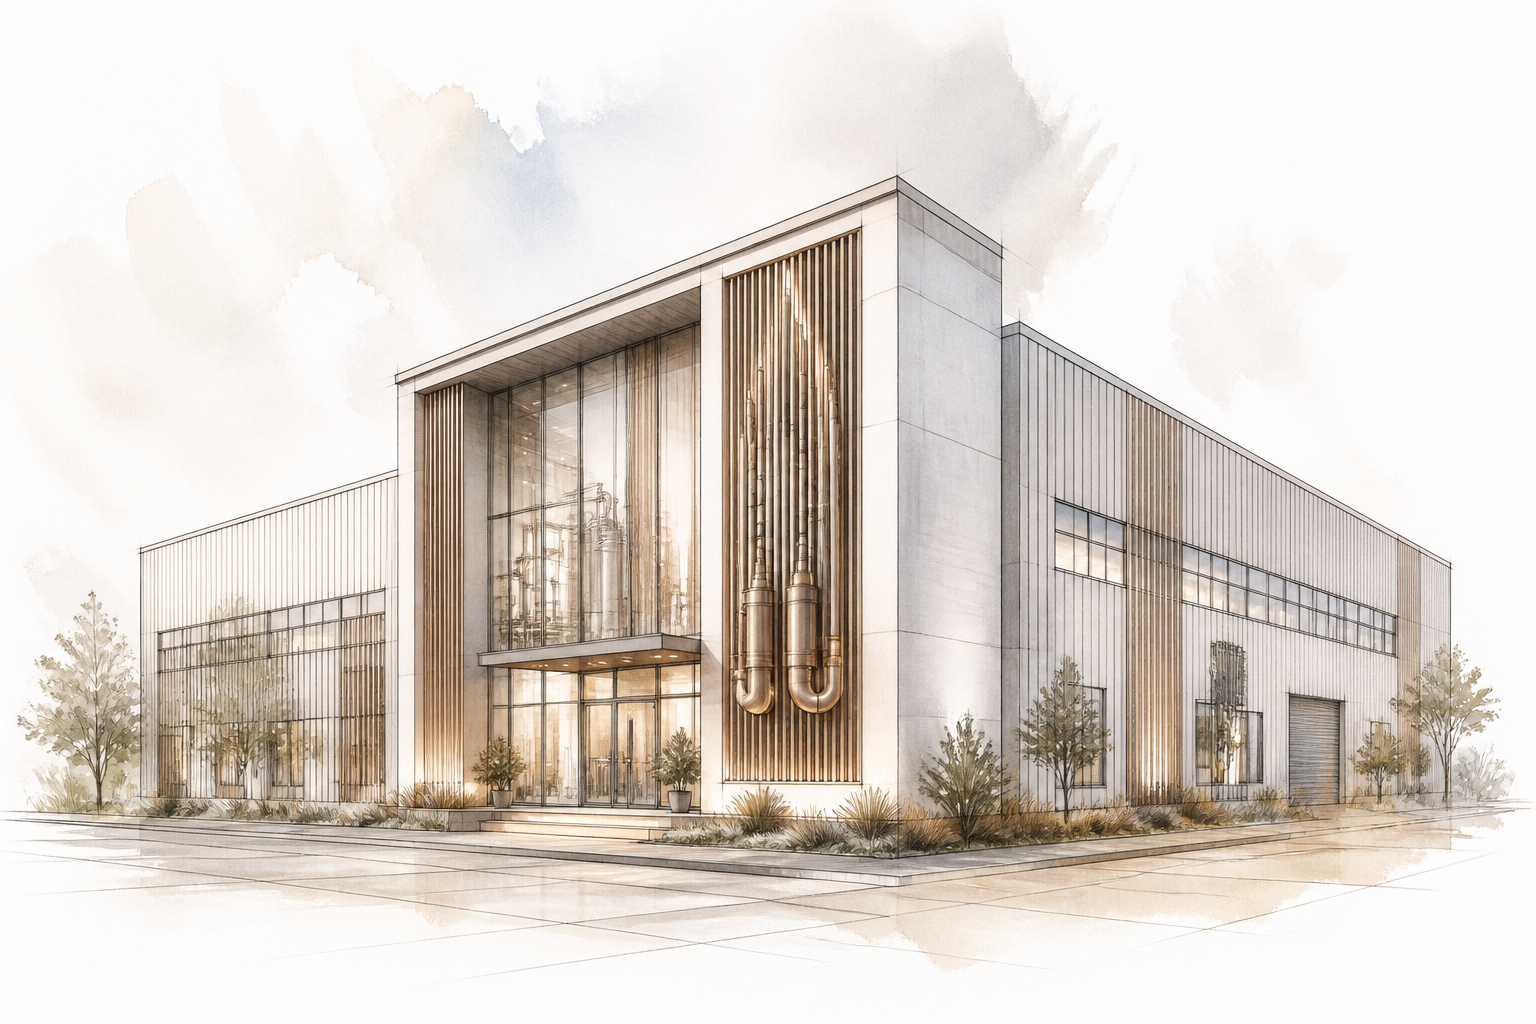
Dye and Pigment Plant Financial Model
Description
The financial model covers a full-scale dye and pigment manufacturing facility—from raw material intake to bulk packaging. It supports multiple product families (acid dyes, reactive dyes, organic/inorganic pigments), each produced in batch reactors with distinct recipes and quality specifications. The model is built for entrepreneurs and financial managers evaluating a specialty chemical production investment.
At its core lies a recipe-driven production engine linking bill-of-materials with expected yields, by-products, and batch cycle times. It explicitly accounts for cleaning and changeover periods between campaigns, quality control sampling, and off-spec rework loops—factors that significantly influence real-world plant throughput and working capital in batch processing.
Beyond standard financial statements, the model embeds environmental compliance: wastewater treatment cost drivers based on effluent volume and contaminant loads (COD, color), air emission permits, and solid waste disposal. Utility consumption (steam, cooling water, electricity) is calculated per batch or per ton, reflecting actual plant energy profiles rather than a fixed percentage of revenue.
The model captures pre-production expenses, main process equipment (reactors, filter presses, dryers, mills), site infrastructure, and initial working capital. It provides an order‑of‑magnitude investment estimate, not a definitive quotation. Users can adjust all cost assumptions in familiar Excel sheets without coding.
Modeling specifics
- Recipe‑based production with yield factors: each product is defined as a bill of materials with an expected yield (90–98%), automatically generating raw‑material needs, by‑product streams, and waste volumes per batch.
- Batch scheduling with changeover logic: equipment occupation includes reaction, filtration, washing, drying, and mandatory cleaning between campaigns; this prevents overestimating annual effective capacity—a typical error that inflates revenue by 20–40%.
- Integrated wastewater treatment costing: effluent volume and contaminant load calculated from recipes drive treatment OPEX (chemicals, energy, sludge disposal); the model avoids treating environmental costs as a fixed overhead.
- Multi‑product margin waterfall: fixed costs are allocated by activity-based drivers (e.g., reactor‑hours) to reveal true profitability per dye or pigment grade, not just an average gross margin.
- Utility consumption modeling per batch/ton: electricity, steam, and water usage are derived from process specifications with separate tariffs, capturing the high energy intensity of chemical synthesis.
- Inventory dynamics for intermediates and finished goods: safety stock, reorder points, and campaign‑driven WIP build‑up are linked to supply lead times, preventing the cash‑flow surprise of understated working capital.
- Regulatory compliance reserves: recurring costs for permits, emission monitoring, and hazardous waste disposal contracts are built into OPEX—items often forgotten in generic spreadsheet templates.
- Sensitivity on raw‑material price spreads: users can stress‑test the impact of petrochemical‑linked intermediates (e.g., naphthalene, aniline) on gross margins, reflecting the sector’s exposure to volatile feedstocks.
What's included in the base version
- Executive dashboard with KPIs (NPV, IRR, payback, DSCR, equity multiple)
- Recipe master data and batch‑driven production plan
- Raw material procurement schedule and landed cost breakdown
- Personnel plan (operators, shift supervisors, chemists, maintenance, administration)
- CAPEX schedule with equipment list, installation, and commissioning timeline
- Operating expenses: utilities, maintenance, consumables, quality control, regulatory compliance
- Monthly Profit & Loss, Cash Flow, Balance Sheet (10‑year horizon)
- Debt and equity financing with flexible drawdowns, grace periods, and repayment profiles
- Tax model (corporate income tax, VAT, property tax, and tax shield)
- Sensitivity and scenario analysis (volume, price, raw materials, FX, discount rate)
- Break‑even and margin‑of‑safety analysis
Common modeling mistakes
- Assuming 100% capacity utilization without changeover and cleaning time: overestimates annual output by 20–40%, making revenue and IRR unrealistically high.
- Neglecting yield losses and off‑spec batches: underestimates raw material consumption by 5–10%, presenting a gross margin that is nearly impossible to achieve in practice.
- Treating wastewater treatment as a fixed overhead: ignores that treatment OPEX scales with effluent volume and contaminant load, masking a 10–20% increase in variable costs as production ramps up.
- Underestimating working capital for raw‑material inventories tied to multi‑month global supply chains: causes a cash deficit that appears 6–9 months earlier than projected, stretching payback by one year or more.