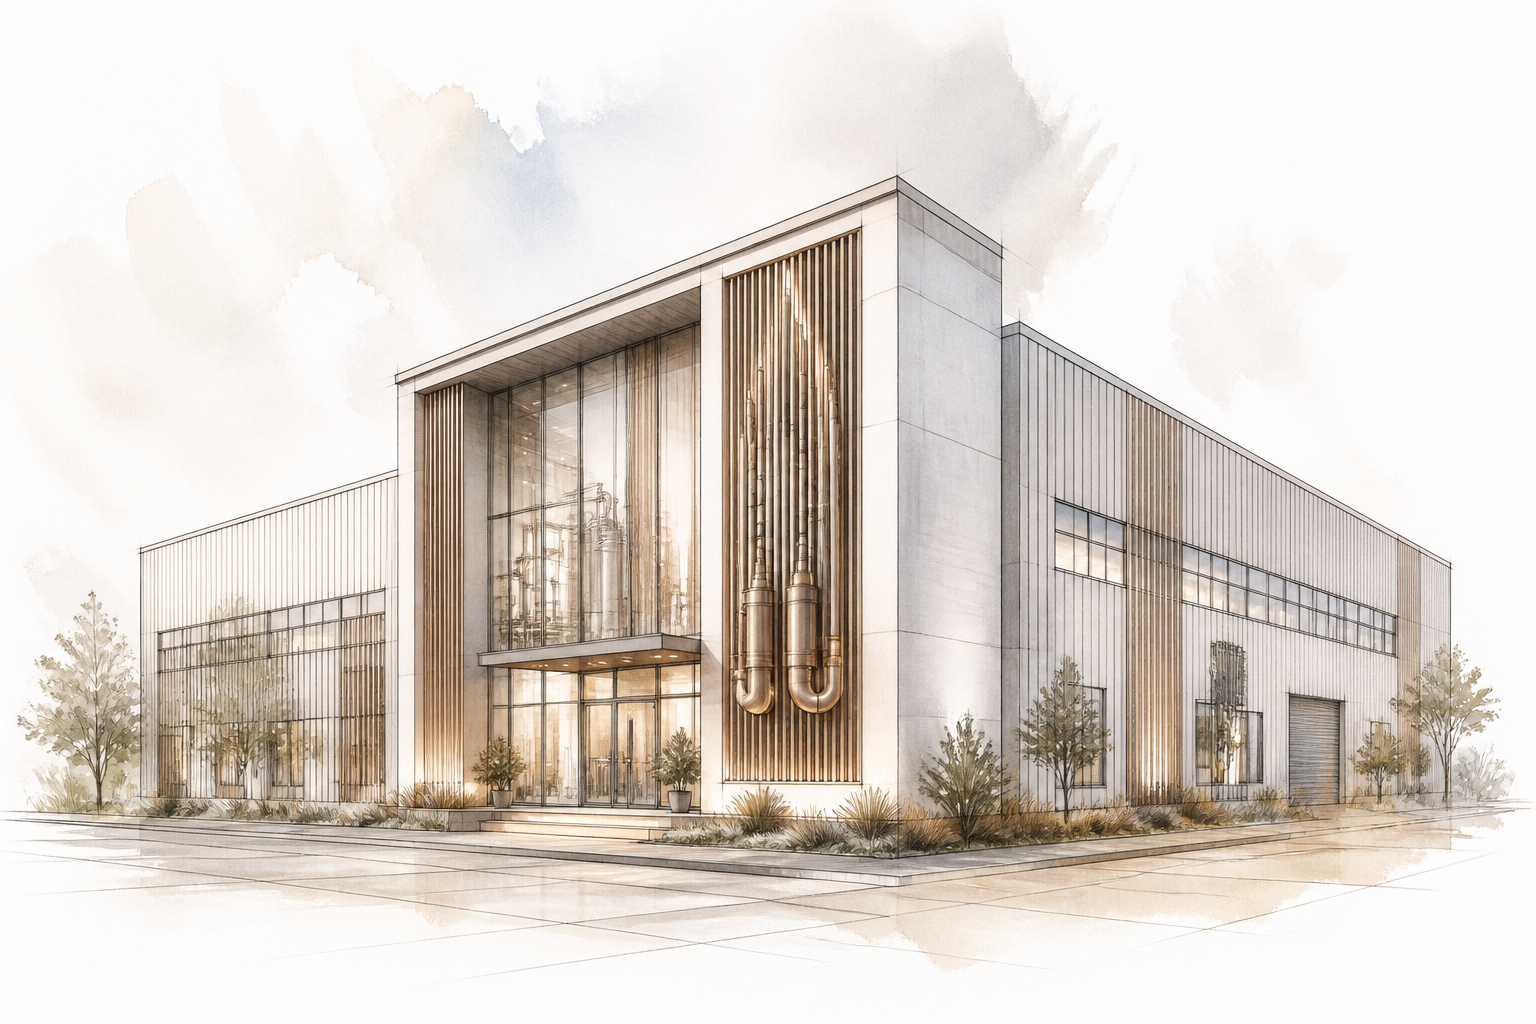
Technical Gas Plant Financial Model
Description
This financial model is designed for a plant producing technical gases (oxygen, nitrogen, argon) via air separation or equivalent technology. It reflects the capital-intensive nature of cryogenic units, onsite generation, and the integrated supply chain of pipeline and liquid deliveries to industrial customers.
The model captures the economics of multiple gas production streams with distinct purity specifications and co-production ratios, enabling accurate revenue forecasting from gas sales and by-product credits. It accounts for the operational constraints of compressors, cold boxes, and storage tanks, including boil-off losses and periodic maintenance shutdowns.
A distinctive feature is the modeling of long-term take-or-pay contracts with minimum volume commitments, price escalation linked to electricity indices and inflation, and the financial impact of penalty clauses for supply shortfalls. The financing structure supports project finance or corporate debt with flexibility.
The total investment is presented to show the order of magnitude for equipment, infrastructure, and pre-operative costs, allowing the user to gauge scale before refining specific quotes.
Modeling specifics
- Multi-product scheduling with co-production yields for O₂, N₂, and Ar, adjusting for purity levels and venting losses dynamically.
- Hourly electricity consumption model based on compressor curves and variable tariff structures, including demand charges and off-peak pricing.
- Pipeline and liquid distribution logistics: tanker fleet sizing, delivery distances, boil-off gas recapture, and cylinder rental economics.
- Take-or-pay contract framework with minimum annual volumes, tiered pricing, escalation formulas, and shortfall penalty calculations.
- Cryogenic storage capacity modeling with boil-off rate, heel management, and replenishment lead times.
- Planned and unplanned maintenance planning that reduces plant availability and drives service contract costs tied to equipment capacity.
- Environmental compliance costs (emission limits, permits) and potential carbon pricing impacts.
- Dynamic working capital model for gas inventory and receivables tied to contract payment cycles.
What's included in the base version
- Revenue module: sales by gas type (O₂, N₂, Ar) and delivery mode (pipeline, liquid, cylinder).
- Production volume and yield dashboard with purity adjustments and venting factors.
- Variable operating cost breakdown: electricity, chemicals, water, consumables.
- Fixed operating costs: personnel, maintenance, insurance, rent, overheads.
- Capital expenditure schedule: equipment, installation, infrastructure, pre-commissioning.
- Depreciation schedule by asset class and tax-compliant amortization.
- Debt and equity financing module (loan terms, drawdown, repayment, reserve accounts).
- Tax module (corporate income tax, VAT where applicable).
- Cash flow waterfall (CFADS, debt service, shareholder distributions).
- Integrated financial statements (P&L, balance sheet, cash flow).
- KPI dashboard (IRR, NPV, payback, DSCR, LLCR, project life metrics).
- Sensitivity tables for key drivers (electricity price, production volume, capex).
Common modeling mistakes
- Ignoring argon and rare gas by-product revenue – underestimates total revenue by 10–20% and extends project payback by 1–2 years.
- Using a flat electricity price per MWh instead of time-of-use tariffs – overstates project IRR by 2–4 percentage points and understates energy expense volatility.
- Assuming 100% plant availability without scheduled maintenance downtime – overestimates annual production by 8–15% and inflates early cash flows.
- Treating all customers as spot sales without contractual minimum volumes – overstates demand risk and can make financing ratios appear stronger than reality.
- Overlooking liquid tanker logistics costs as a separate line item – understates distribution expense by up to 15–25% of delivery-related costs, distorting net margin by several percentage points.
- Not modeling boil-off gas losses in storage – overestimates deliverable liquid volume by 1–3% per year, leading to a persistent cash overstatement.
- Neglecting working capital for cylinder deposits and rental – results in a cash shortfall in early operating months and underestimates initial working capital need by 2–3 months of operating expenses.
- Applying a single cost escalation index to all expenses – understates energy-driven inflation by 10–20% over the project life, causing later-year margin overstatement.