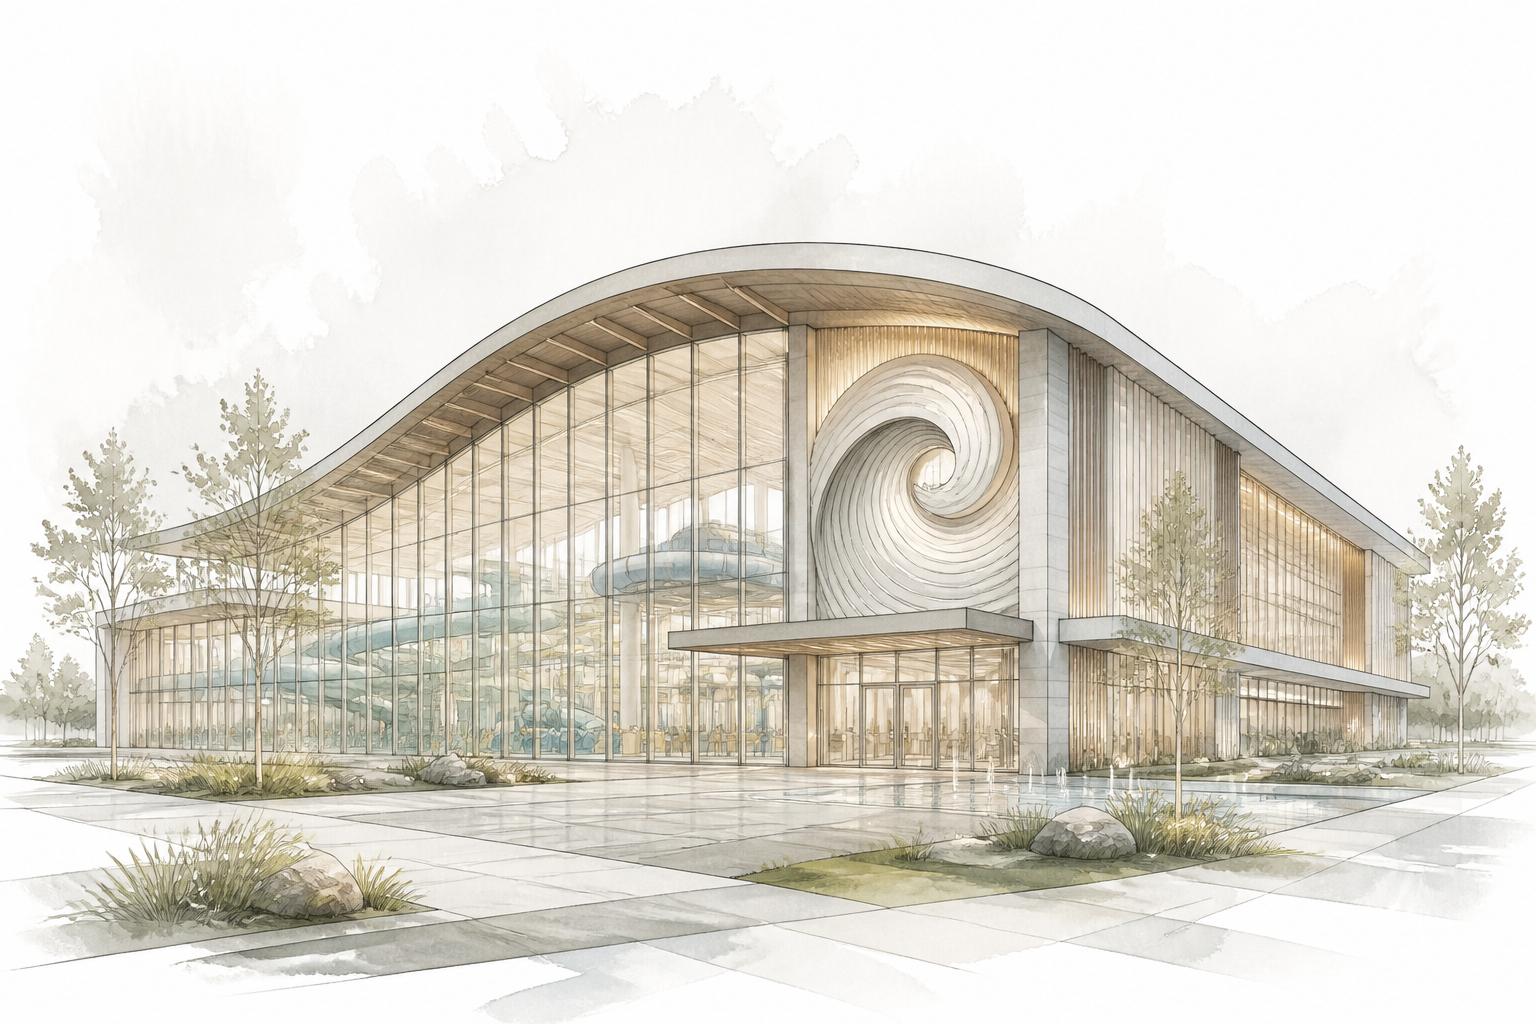
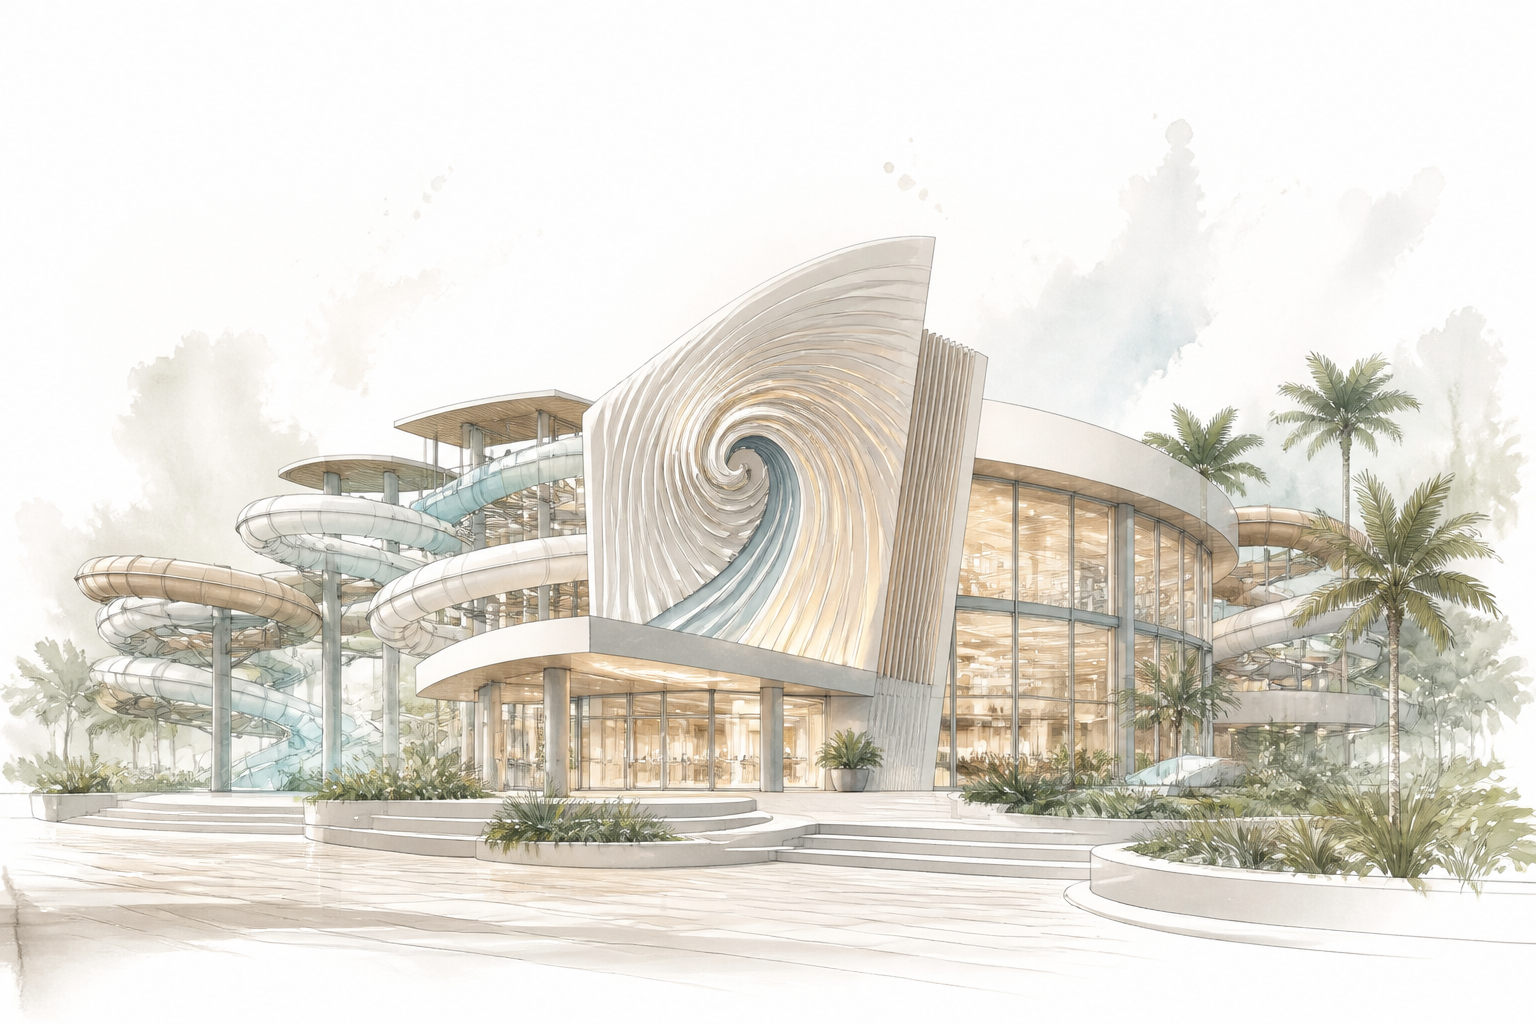
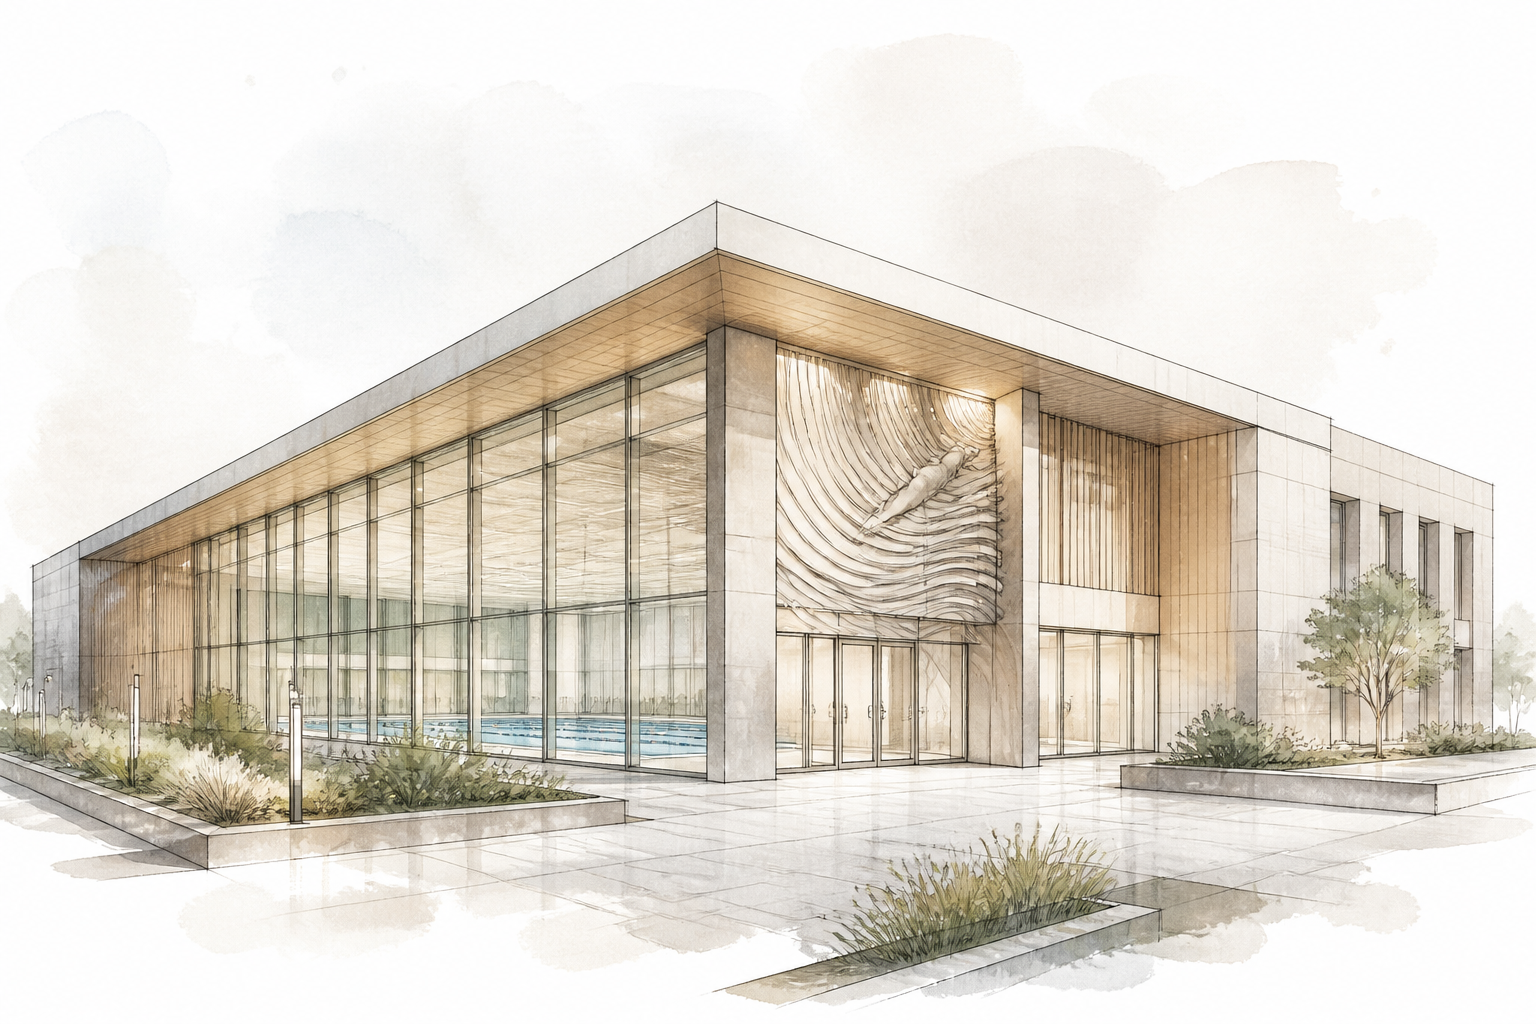
Indoor Year-round Water Park Financial Model
Description
A comprehensive financial model for an indoor, year-round water park that combines multiple revenue streams—daily admission, season passes, F&B, lockers, merchandise and event hosting—under a single climate-controlled roof. The model reflects the unique economics of a fully enclosed facility where attendance is decoupled from weather but still subject to intra-year patterns driven by school holidays, weekends and public festivities. All operating costs are tied directly to guest volume and operational hours, giving the operator clear visibility into margin dynamics across seasons.
The model meticulously captures the physics-based cost structure of an indoor aquatic environment: water heating and make-up water, humidity control via HVAC and dehumidification, chemical dosing for multiple pools and slides, and electricity for high-volume pumps and lighting. It translates square-meter water surface, ambient outdoor temperature and bather load into line-by-line utility and consumable expenses, allowing accurate projection of the single largest OPEX categories.
Revenue drivers are broken down by visitor segments (adult, child, family, group) and product types (day pass, annual membership, fast pass, cabana rental). The model handles controlled capacity thresholds—maximum instantaneous occupancy, turnover rates and slide throughput—to prevent overstatement of achievable revenue. Staffing logic allocates lifeguards, slide operators, F&B attendants and technical maintenance according to peak-period safety ratios and local regulatory requirements, generating a compliant payroll forecast.
On the investment side, the model accommodates detailed CAPEX phasing: civil works, water attraction procurement and installation, filtration plants, climate systems and soft costs such as pre-opening marketing and training. A financing module supports senior debt, mezzanine and equity with flexible drawdowns and repayment schedules. The result is a fully integrated P&L, cash flow and balance sheet structure that lets an investor or developer test scenarios ranging from conservative ramp-up to aggressive expansion.
Modeling specifics
- Hourly visitor-flow engine with daily and weekly seasonality curves, differentiating between peak and off-peak indoor patterns without relying on outdoor weather triggers.
- Physics-based water and air thermal model: outdoor temperature and humidity drive heat loss from pool surfaces, ventilation loads and make-up water demand, directly linking location climate to energy OPEX.
- Chemical consumption algorithm calibrated to total bather load, water surface area and splash-out rates, preventing understatement of water treatment costs by up to 30–40%.
- Attraction uptime calendar: mandatory periodic shutdowns for slide inspection, pool draining and filter backwashing are scheduled and reduce effective hourly capacity, ensuring realistic revenue caps.
- Dynamic lifeguard deployment matrix based on visitor count, open attractions and legally mandated lifeguard-to-guest ratios, generating a precise payroll that follows operational peaks.
- Multi-tiered ticketing engine supporting day passes, seasonal memberships (with blackout dates) and bundled group packages, capturing the margin dilution vs. volume uplift of each channel.
- F&B and retail projections driven by capture rates and per-head spend that vary by session length and visitor profile, not a flat percentage of admission revenue.
- Integrated CAPEX builder that separates shell construction, ride procurement, HVAC, filtration and theming, assigning distinct depreciation lives and maintenance schedules to each asset class.
What's included in the base version
- Fully integrated 10-year financial statements (P&L, cash flow, balance sheet).
- Attendance and capacity module with seasonal curves and peak-day handling.
- Revenue build-up for admission tickets, season passes, F&B, retail, lockers, cabanas and event hosting.
- Direct operating cost schedule (staff, chemicals, energy, water, maintenance) linked to guests and operating hours.
- Indirect OPEX and SG&A schedule with fixed and variable cost allocation.
- CAPEX and depreciation schedule with asset-level tracking for multiple investment phases.
- Debt and equity financing module with flexible drawdowns, grace periods and cash sweep logic.
- Investment metrics dashboard (project IRR, equity IRR, payback, NPV).
Common modeling mistakes
- Ignoring dehumidification and pool water heating loads — utility costs understated by 25–40%.
- Applying a flat annual occupancy rate without daily capacity caps — overstates achievable attendance and revenue by 15–25%.
- Omitting mandatory downtime for slide inspection and filter maintenance — effective ride capacity overstated by 8–15%.
- Sizing lifeguard staff only for average attendance rather than peak instantaneous load — payroll underestimated by 20–30%.
- Using a single admission price without modeling season pass cannibalization — causes per-capita revenue to be overestimated by 10–20%.
- Budgeting chemical expenses as a fixed monthly cost — OPEX understated by 10–20% during high-season months due to bather-load dependency.