Seasonal Outdoor Water Park Financial Model
Description
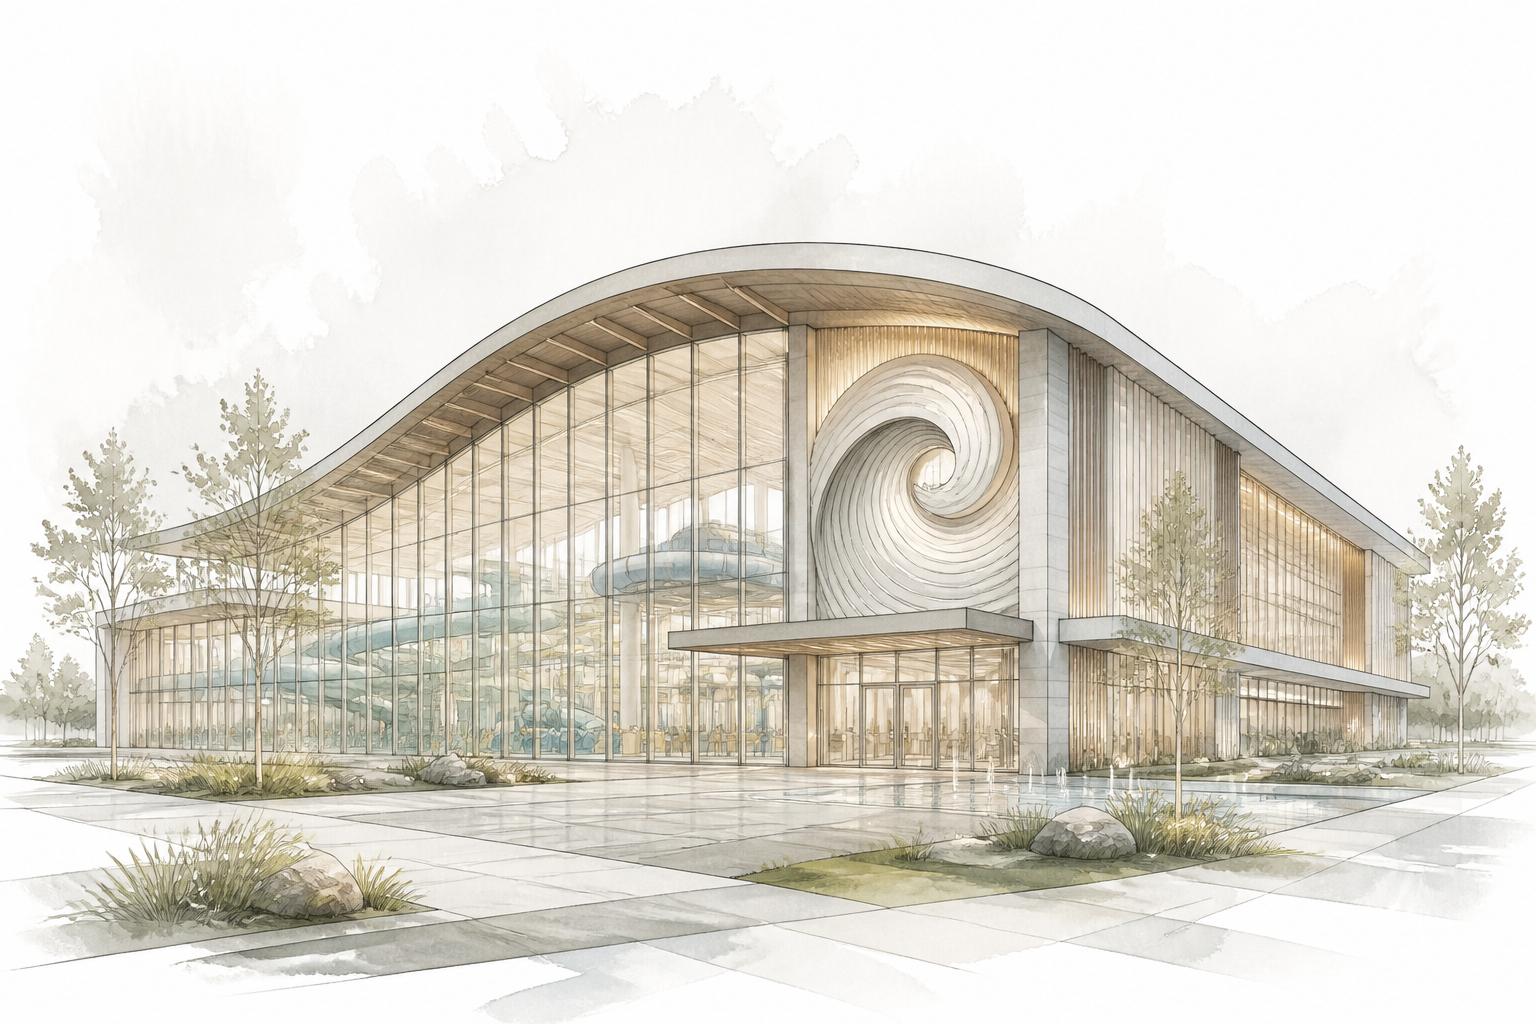
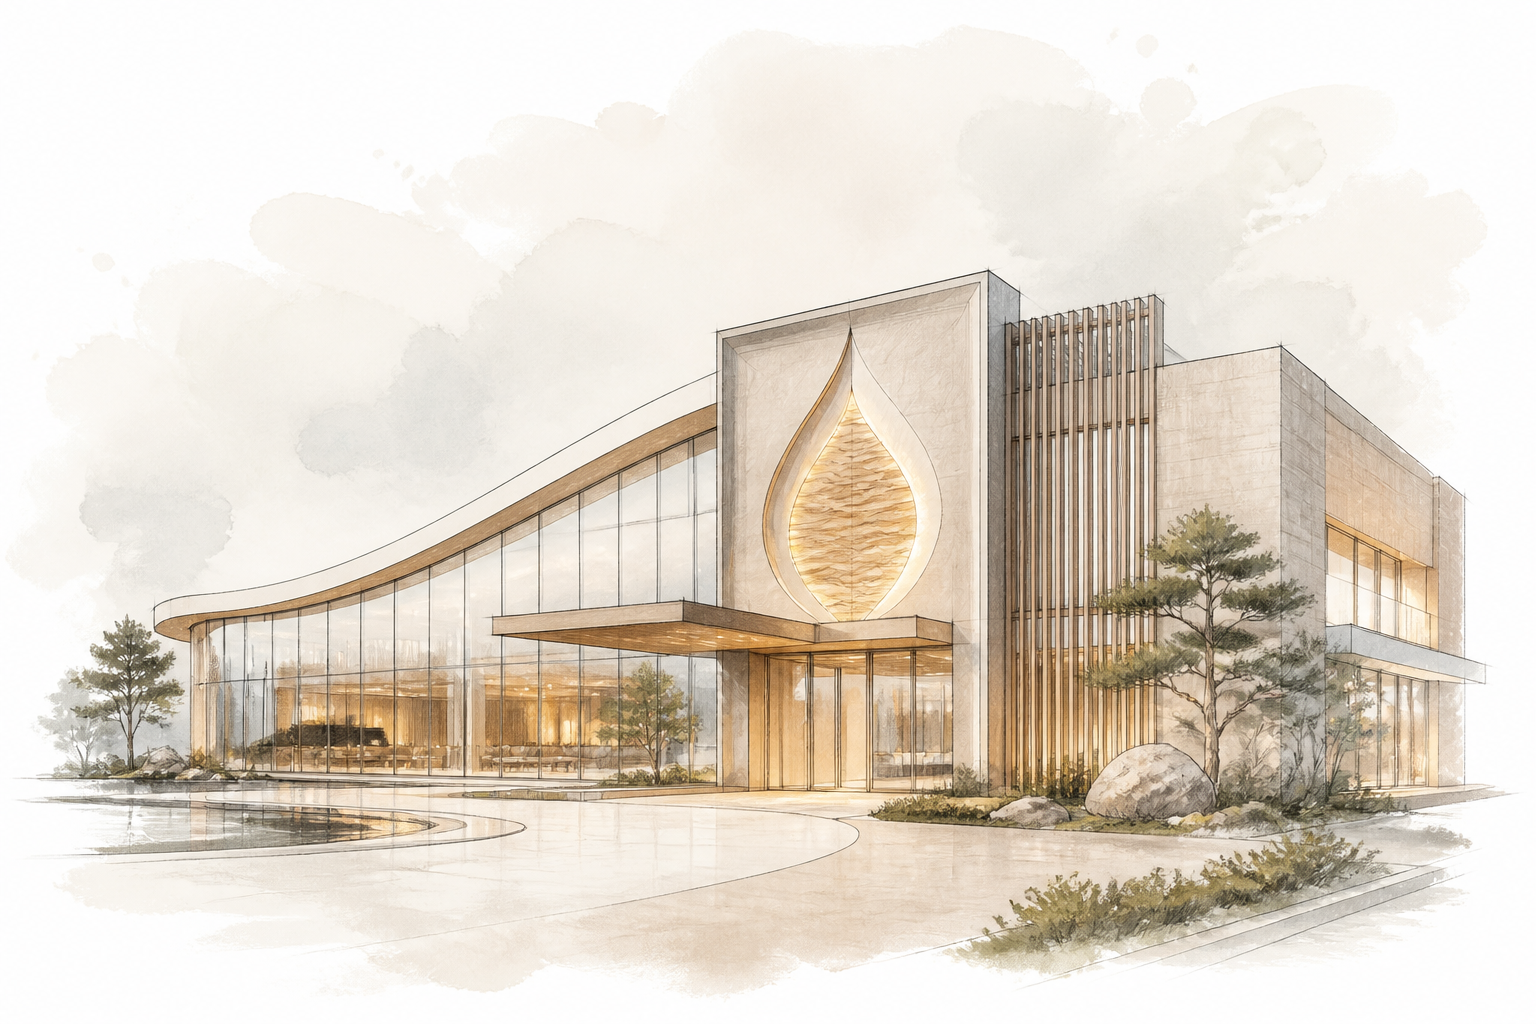
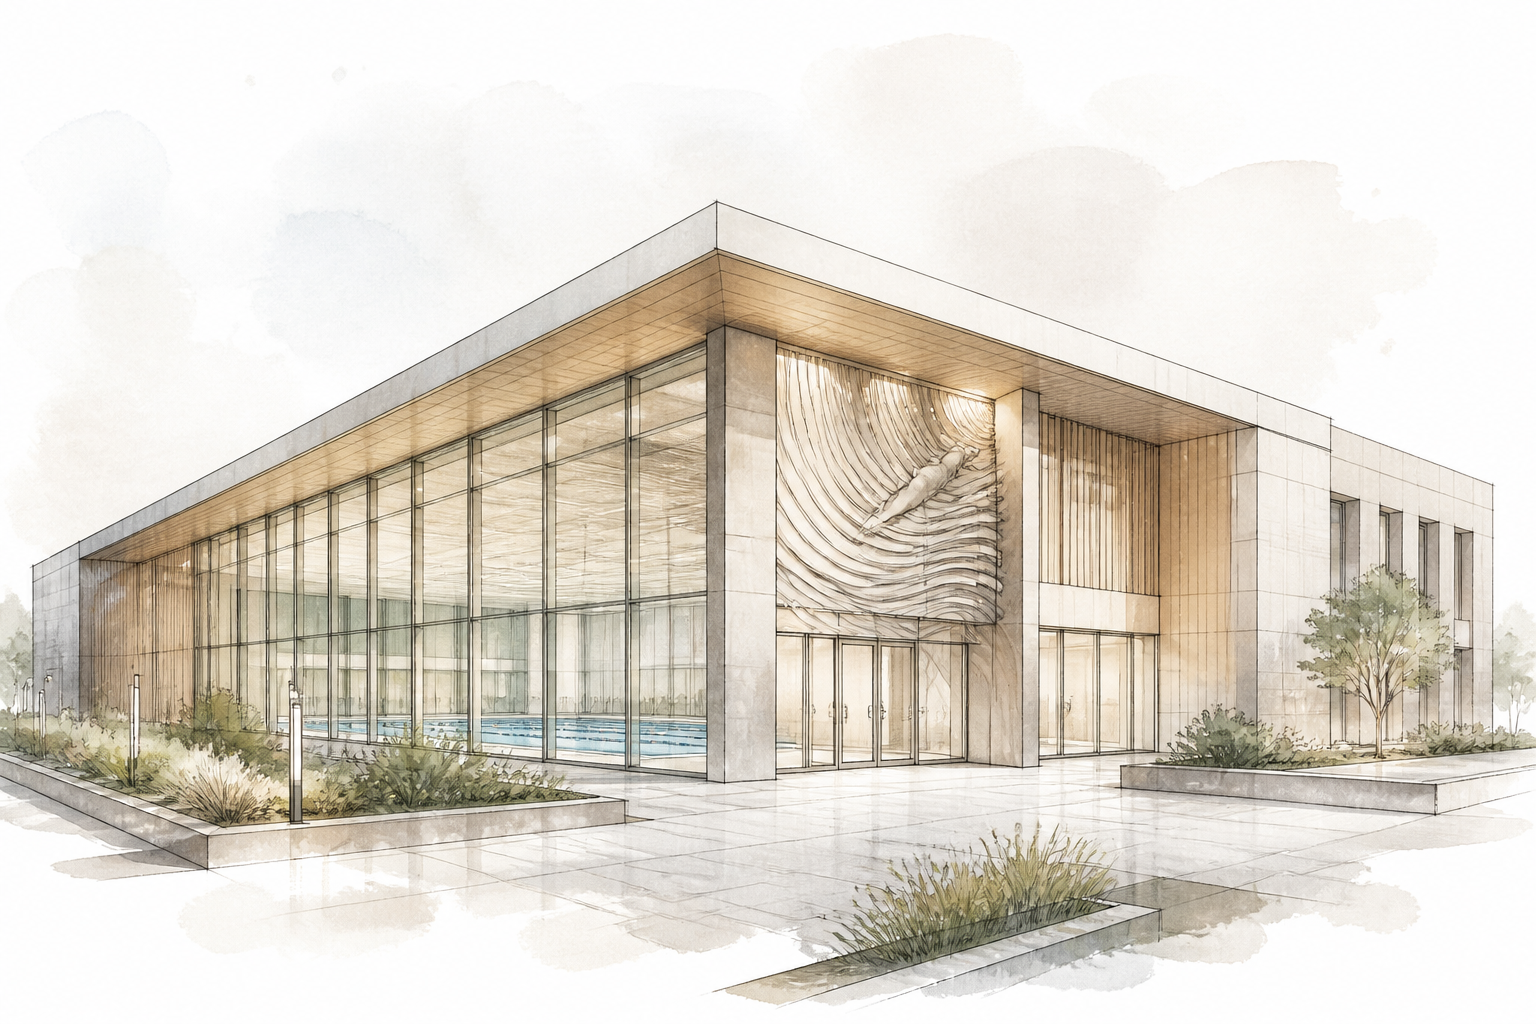
This model is purpose-built for a seasonal outdoor water park, capturing the unique rhythm of a business that earns the bulk of its revenue over a 3–5 month summer window. It integrates granular daily attendance drivers—day-of-week, school calendars, public holidays, and real weather patterns—to produce realistic seasonal revenue curves and cash flows.
All core revenue streams are included: day tickets, season passes, cabana rentals, food and beverage, retail, parking, and special events. The model simulates how weather (rain, temperature thresholds) affects walk-up ticket sales and on-site spend differently from pre-sold passes, with dynamic capacity management across slides, wave pools, and lazy rivers to avoid overstating peak-day potential.
The investment side covers the entire CAPEX programme—land, attraction equipment, wave generation systems, filtration plants, theming, and back-of-house infrastructure—phased over a multi-year construction timeline. Operating expenses self-adjust to seasonality: lifeguard staffing scales with guest count and pool area, utility costs are driven by actual water volume and filtration turnover, and ride maintenance follows manufacturer-prescribed cycles with a sinking fund.
Financing is modeled with flexible debt structures, seasonal repayment sweeps, and pre-season working capital facilities. The model also handles depreciation of short-life themed assets, tax incentives (if any), and exit scenarios, giving an institutional-grade view of a capital-intensive seasonal leisure project.
Modeling specifics
- Daily attendance engine that blends baseline seasonality curves with day-of-week factors, school term calendars, and local public holidays.
- Weather-response logic that differentiates the impact of rain, extreme heat, and overcast conditions on walk-up ticket purchases, season-pass visits, and in-park spending.
- Hourly capacity modelling per attraction (slides, wave pool, lazy river) with guest queue time thresholds that feed back into guest satisfaction and repeat-visit assumptions.
- Phased CAPEX draw schedule linked to construction milestones, with separate commissioning dates for different ride clusters and partial season openings.
- Lifeguard staffing model that computes required headcount by pool type and bather-load, then builds a seasonal ramp-up/ramp-down payroll forecast.
- Utility cost engine driven by pool volumes, water turnover rates, chemical dosing protocols, and pump power requirements, adjusting automatically for variable operating hours.
- Ride-specific maintenance reserve schedules based on manufacturer-recommended overhaul intervals (e.g., major slide refurbishment every 3–5 years) rather than a flat OpEx %.
- Debt service with cash-flow sweeps, seasonal reserve accounts, and covenants, recognizing that debt capacity must accommodate a highly uneven cash profile.
What's included in the base version
- Executive summary dashboard with key KPIs and visual output charts
- Seasonal weather and attendance model with daily granularity
- Revenue modules: tickets, season passes, cabanas, F&B, retail, parking, events
- CAPEX schedule with multi-year construction phasing
- Asset register and depreciation (straight-line and accelerated, including short-life themed items)
- Operating expense blocks: staffing (lifeguards, operations, admin), utilities (water, electricity, chemicals), marketing, maintenance, insurance
- Debt and equity financing module with flexible drawdowns and debt service
- Cash flow waterfall, IRR, NPV, and investor returns (no benchmark numbers, model built to compute them)
- Sensitivity tables for attendance, ticket price, weather, and CAPEX
- Professional formatting, error checks, and model map
Common modeling mistakes
- Applying a flat monthly attendance curve without day-of-week and holiday weighting — overstates peak-season revenue by 15–25%.
- Ignoring mandatory lifeguard-to-bather ratios and local safety staffing codes — understates labour cost by 20–30%, fundamentally altering breakeven.
- Using a constant OpEx % for ride maintenance instead of ride-specific overhaul cycles — understates costs in later operating years by 10–15%, hiding a post-year-5 cash squeeze.
- Treating all ticket buyers as equally weather-sensitive — overstates walk-up revenue in moderate rain by a factor of 1.5–2x and misrepresents risk.
- Failing to reserve pre-season working capital for inventory build-up, marketing campaigns, and hiring/training — creates a cash shortfall of several months of pre-opening fixed costs.
- Assuming full rated capacity on every peak day without modelling ride throughput and queue abandonment — overstates maximum daily revenue by 30–40%.